Social Security Disability Insurance at Age 60: Does It Still Reflect Congress' Original Intent?
Issue Paper No. 2015-01 (released September 2015)
Congress established the Social Security Disability Insurance (DI) program in 1956, after more than 20 years of debate. From the outset of the debate, however, there had been general agreement that the DI program should be for workers with substantial work histories, be funded through payroll taxes, include stringent disability criteria, provide modest benefit levels, and require return-to-work supports. Using administrative data on current DI beneficiaries, this issue paper examines how the program reflects those original tenets as it nears its 60th anniversary.
Paul O'Leary, Elisa Walker, and Emily Roessel are with the Office of Retirement and Disability Policy, Social Security Administration. Questions about the analysis should be directed to the authors at (202) 358-6227, (202) 358-6220, or (202) 358-6138, respectively.
The findings and conclusions presented in this paper are those of the authors and do not necessarily represent the views of the Social Security Administration.
The original version of this Issue Paper inaccurately characterized the benefit amount data in Table 1 and the accompanying narrative. The benefit amounts in the table and the text were described as reflecting the total amounts paid from the Disability Insurance Trust Fund. In fact, these amounts exclude various adjustments to payments, primarily in the form of retroactive payments to new awardees. Because the benefit amounts accurately reflected the payment amounts without these adjustments, they have not been changed; however, a note and a footnote in Table 1 and the accompanying narrative now clarify the distinction, and provide the amount of total benefits paid. [Posted: April 6, 2016.]
Background
| AWI | average wage index |
| DI | Disability Insurance |
| NBS | National Beneficiary Survey |
| SIPP | Survey of Income and Program Participation |
| SSA | Social Security Administration |
Federal disability benefits under the Social Security Disability Insurance (DI) program were first authorized by the Social Security Act Amendments of 1956.1 Congress debated the parameters of the DI program for more than 20 years prior to its enactment. From the beginning, however, the program under discussion had five basic tenets: (1) benefits would be for individuals with established work histories who were unable to continue working because of disability; (2) benefits would be earned under the program and paid for with dedicated contributions; (3) the definition of disability would be strict, requiring a medically determinable impairment that prevented substantial work and was expected to last indefinitely; (4) benefits would be modest, providing workers who became disabled with a basic level of financial security; and (5) return to work would be encouraged and supported through the provision of vocational services. The return-to-work aspects of the DI program have received considerable attention elsewhere,2 but less is known about how the other concepts have shaped the program and are reflected in its present form. This issue paper uses Social Security Administration (SSA) data on the current beneficiary population to examine how the first four founding principles are realized in the DI program as it exists today, nearly 60 years later.
How Many People Receive DI Benefits?
In December 2014, nearly 9 million disabled workers received social insurance benefits under the DI program (Table 1). Since the passage of the 1958 amendments to the Social Security Act, the DI program has also provided benefits to the spouses and minor children of millions of disabled workers.3 In December 2014, 1.8 million children and 148,955 spouses of disabled workers received these “auxiliary” benefits from the DI Trust Fund.
| Number or amount | Total | Disabled workers | Children | Spouses |
|---|---|---|---|---|
| Number of beneficiaries | 10,931,092 | 8,954,518 | 1,827,619 | 148,955 |
| Average benefit amount ($) | ||||
| Monthly | 1,017 | 1,165 | 349 | 315 |
| Annual equivalent | 12,208 | 13,985 | 4,188 | 3,774 |
| Aggregate benefits paid ($ in millions) | ||||
| Monthly | 11,120 | 10,436 | 638 | 47 |
| Annual equivalent | a 133,442 | 125,226 | 7,654 | 562 |
| SOURCE: SSA (n.d. a). | ||||
| NOTES: Benefit amounts exclude retroactive payments and other adjustments. Totals do not necessarily equal the sum of rounded components. | ||||
| a. Total benefit payments from the DI Trust Fund in 2014, including retroactive payments and other adjustments, were $141.6 billion (see https://www.socialsecurity.gov/OACT/ProgData/payment.html). | ||||
The average benefit amount for disabled workers (excluding retroactive payments, primarily to new awardees for the period between entitlement date and first benefit receipt) was about $1,165 a month in December 2014, equivalent to $13,985 a year. The combined benefits for disabled workers, their spouses, and their children were about $11.1 billion in December 2014, equivalent to about $133.4 billion over the course of a year. Including the retroactive payments and other adjustments, the aggregate income that flowed into the national economy from the DI Trust Fund was $141.6 billion in 2014.
DI Beneficiaries Have Significant Work and Earnings Histories
Although Congress has amended the DI program many times over the years, its basic structure remains very close to that first enacted in 1956. The program was designed to provide social insurance protection for individuals with demonstrated work histories. To become insured for DI benefits, a worker must pay into Social Security and earn work credits by accruing earnings that meet or exceed statutory thresholds. In the 1956 DI law (as in the early years for the retirement program), a worker received one work credit for earnings of at least $50 per calendar quarter. By 2014, the earnings threshold for one credit had risen to $1,200 and was no longer tied to calendar quarters.4 Workers are generally insured for benefits if they have worked and earned at least one-fourth of the maximum possible work credits since reaching age 21 and at least half of the maximum possible work credits in the 10 years before disability onset. (The latter requirement is proportionally reduced for workers younger than age 31.)
Most current disabled-worker beneficiaries far exceeded the minimum work-credit thresholds for eligibility, earning most of the work credits that were possible during their adult lives before becoming eligible for benefits (Chart 1). In fact, three-quarters of them had earned 80 percent or more of the possible work credits since reaching age 21, and more than half had earned the maximum four work credits in each of the years between reaching age 21 and eligibility for DI benefits. On average, current disabled-worker beneficiaries earned the equivalent of 22 years of work credits before becoming disabled. Those who became disabled at age 50 or later had earned the equivalent of more than 30 years of work credits, on average.
Percentage distribution of DI disabled-worker beneficiaries, by work credits earned between age 21 and DI eligibility a (as a percentage of maximum possible work credits in that period), December 2013
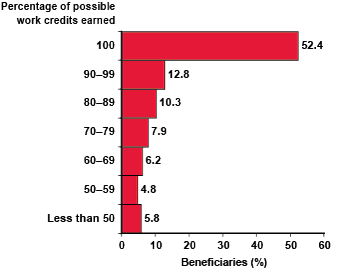
| Percentage of possible work credits earned | Percent of beneficiaries |
|---|---|
| 100 | 52.4 |
| 90–99 | 12.8 |
| 80–89 | 10.3 |
| 70–79 | 7.9 |
| 60–69 | 6.2 |
| 50–59 | 4.8 |
| Less than 50 | 5.8 |
Preaward earnings levels provide an approximate indicator of the standard of living that disabled workers had attained before serious health conditions led to their DI eligibility. Table 2 shows that in their 5 highest-earning years before DI eligibility, disabled workers earned an average of $42,156 a year (expressed in 2014 wage levels)—or slightly lower than the projected 2014 national average wage index (AWI) of $46,787.5 Adjusted predisability annual earnings were $36,186 for median earners, just under $56,800 for workers at the 75th percentile, and just under $21,800 for those at the 25th percentile. Average annual earnings in the top 5 earnings years prior to the start of DI benefits were 36 percent higher for male disabled workers than for female disabled workers.
| Percentile | Overall | Men | Women |
|---|---|---|---|
| 25th | 21,756 | 25,499 | 19,323 |
| 50th (median) | 36,186 | 43,358 | 30,637 |
| 75th | 56,752 | 66,531 | 45,945 |
| Mean | 42,156 | 48,305 | 35,476 |
| SOURCE: Authors' calculations based on SSA's 2013 Disability Analysis File and 2013 Master Earnings File. | |||
| NOTES: Values reflect all earned income, including earnings exceeding the Social Security taxable maximum. | |||
| Years with zero earnings are included among the top 5 when applicable (only for beneficiaries entitled at age 31 or younger). | |||
| a. Earnings are adjusted to the projected national AWI for 2014. | |||
Predisability Industry Distribution of Current DI Beneficiaries
Before becoming eligible for DI benefits, workers were employed in a variety of industries (Table 3). Nearly half worked in service industries, and 18 percent worked in retail trade. For disabled-worker beneficiaries, Table 3 includes breakdowns by sex that highlight notable gender differences in many industries. Men are more likely to have worked in manufacturing and construction, while women are more likely to have worked in services. Within the services group, there is substantial variation in certain subcategories. Most notably, women are nearly four times as likely as men to have worked in health services, while men are more likely to have worked in business or automotive services.
| Industry | Disabled workers (2013) | Total employment | |||
|---|---|---|---|---|---|
| Men | Women | Total | 2002 | 2012 | |
| Agriculture, forestry, and fishing | 3.7 | 1.2 | 2.5 | 1.7 | 1.5 |
| Mining | 1.1 | 0.1 | 0.6 | 0.4 | 0.6 |
| Construction | 7.8 | 0.7 | 4.4 | 5.0 | 4.1 |
| Manufacturing | 15.3 | 9.2 | 12.4 | 11.4 | 8.7 |
| Transportation, communications, electric, gas, and sanitation | 6.9 | 3.3 | 5.1 | 3.6 | 3.6 |
| Wholesale trade | 3.5 | 1.9 | 2.7 | 4.2 | 4.2 |
| Retail trade | 16.2 | 19.4 | 17.8 | 11.3 | 10.9 |
| Finance, insurance, and real estate | 6.2 | 8.1 | 7.1 | 5.9 | 5.7 |
| Services | 38.6 | 55.6 | 46.8 | 40.3 | 44.6 |
| Hotels, rooming houses, camps, and other lodging places | 1.2 | 2.3 | 1.7 | a | a |
| Personal services | 0.7 | 1.6 | 1.1 | a | a |
| Business services | 12.9 | 11.3 | 12.1 | a | a |
| Automotive and miscellaneous repair services and parking | 3.2 | 1.3 | 2.3 | a | a |
| Amusement, recreation, parks, and museums | 3.5 | 3.5 | 3.5 | a | a |
| Health services | 4.2 | 16.3 | 10.1 | a | a |
| Legal services | 0.2 | 0.8 | 0.5 | a | a |
| Educational services | 1.9 | 3.6 | 2.7 | a | a |
| Social services | 2.7 | 5.8 | 4.2 | a | a |
| Membership organizations | 1.2 | 1.6 | 1.4 | a | a |
| Engineering, accounting, research, management, and related services | 3.8 | 4.3 | 4.1 | a | a |
| Miscellaneous services | 3.0 | 3.4 | 3.2 | a | a |
| Public administration | 0.6 | 0.6 | 0.6 | 16.1 | 16.1 |
| SOURCES: Authors' calculations based on SSA's 2013 Disability Analysis File, SSA's 2012 Continuous Work History Sample, and Bureau of Labor Statistics (2013). | |||||
| NOTES: “Industry of last employment” reflects the most recent job (within 10 years) prior to the date of current eligibility for disabled-worker benefits. If a beneficiary worked more than one job in the most recent year, the highest-paying of those jobs determines the industry. | |||||
| Calculations include adjustments to account for slight interagency differences in industry category definitions as well as to intra-agency revisions to those definitions over time. | |||||
| Rounded components of percentage distributions do not necessarily sum to 100.0. | |||||
| a. Inconsistencies in the service-industry subcategory definitions used by SSA and the Bureau of Labor Statistics (and between those used by the Bureau of Labor Statistics in 2002 and in 2012) prevent useful cross-column comparisons. | |||||
Table 3 also shows the industry distribution of all U.S. workers for comparison. Because the industry composition of American workers has changed over time (with jobs generally moving from manufacturing to services), and because the last pre-DI jobs held by current disabled-worker beneficiaries span many years, the table shows the all-worker industry distributions for both 2002 and 2012.
Generally, the industry distribution of the former jobs of disabled workers is similar to that of all workers. The most notable exception is that DI beneficiaries are far less likely than American workers overall to have worked in jobs classified as public administration (1 percent versus 16 percent). This is, in part, because about a quarter of state and local government employees and all federal workers hired before 1984 are not covered by Social Security. DI beneficiaries are more likely than workers overall to have worked in retail trade (18 percent versus 11 percent) and in agriculture, forestry, and fishing (3 percent versus 2 percent). For some industries, the patterns are mixed, depending on which year of the all-worker distribution is used. The proportion of DI beneficiaries that last worked in manufacturing jobs (12 percent) is considerably higher than the proportion of manufacturing workers overall in 2012 (9 percent); but it is much closer to the manufacturing share of total employment in 2002 (11 percent), when more of today's beneficiaries presumably were still working. The reverse is true for services: The service-industry share of DI beneficiaries (47 percent) is slightly higher than the service-industry share of overall employment in 2012 (45 percent), but is much higher than its share in 2002 (40 percent). Overall, however, the industry distribution of predisability jobs for DI beneficiaries is fairly close to that for total employment.
DI Beneficiaries Have Significant Impairments and Many Are Older
Social Security's test of disability is very strict. Benefits are paid only to those who have a medically determinable physical or mental impairment that precludes any substantial work activity and is expected to last at least a year or result in death in less than a year. A worker must be unable to perform not just his or her own prior job but any job that exists in significant numbers in the national economy (taking the worker's age, education, and work experience into account). The Organisation for Economic Co-operation and Development, which includes 34 member countries, describes the U.S. system (along with those of Canada, Japan, and South Korea) as having “the most stringent eligibility criteria for a full disability benefit, including the most rigid reference to all jobs available in the labour market” (OECD 2010, 89).
Nearly one-third of disabled-worker beneficiaries have a musculoskeletal condition—such as severe arthritis, back injuries, or other disorders of the skeleton and connective tissues—as their primary diagnosis (SSA 2014, Chart 6). Another one-third have a mental disorder as their primary diagnosis. Calculations using SSA's Disability Analysis File (DAF) indicate that many beneficiaries (62 percent) have multiple disabling conditions. Some disabled-worker beneficiaries have life-threatening conditions such as stage-4 cancers, amyotrophic lateral sclerosis, leukemia, or end-stage renal disease. One in five men and nearly one in six women who enter the program die within 5 years (Zayatz 2011, Table 13).
The risk of becoming disabled rises sharply with age. Because the program was originally intended for older workers who were nearing retirement but could not continue working because of disability, only workers aged 50–64 were eligible when DI was added to Social Security in 1956. Individuals who were still receiving disability benefits when they reached full retirement age (65 at the time) would automatically shift to receiving retirement benefits. This automatic transition to retirement benefits remains in effect, although the full retirement age has since increased.
The Social Security Act Amendments of 1960 broadened the DI eligibility criteria to include younger workers; nevertheless, older workers still dominate the beneficiary population. About two-thirds of new disabled-worker awardees in 2013 were aged 50 or older; nearly one in five were aged 60 or older. Of all disabled workers receiving benefits in December 2013, 72 percent had reached age 50 and 32 percent had reached age 60 (SSA 2014, Tables 39 and 19).
DI Benefits Are Modest, Yet They Help Families Stay Afloat Financially
When DI was established in 1956, Congress adopted the same formula to set benefit levels that it had established 20 years earlier for the Social Security retirement program, with the difference that disability benefits could be based on fewer years of work, as necessitated by the onset of disability. Having established retirement benefits “as a right rather than as public charity, and in amounts which will insure not merely subsistence but some of the comforts of life” (House Ways and Means Committee 1935), Congress extended this same purpose to disabled-worker benefits in 1956. As such, DI benefits were designed to be modest relative to average U.S. wages. Since 1956, the benefits for disabled workers have averaged 30 percent of the national AWI, and at the end of 2014, the average annualized benefit ($13,985) is 30 percent of the projected national AWI for 2014 ($46,787). More than one-third (34 percent) of disabled-worker beneficiaries receive a benefit of less than $900 a month, 23 percent receive more than $1,500 a month, and the remaining 42 percent receive between $900 and $1,500 a month (Chart 2).
Percentage distribution of DI disabled-worker beneficiaries, by monthly benefit amount, December 2014
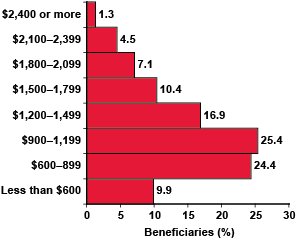
| Monthly benefit amount (dollars) | Percent of beneficiaries |
|---|---|
| 2,400 or more | 1.3 |
| 2,100–2,399 | 4.5 |
| 1,800–2,099 | 7.1 |
| 1,500–1,799 | 10.4 |
| 1,200–1,499 | 16.9 |
| 900–1,199 | 25.4 |
| 600–899 | 24.4 |
| Less than 600 | 9.9 |
DI benefits, although modest, are nonetheless the main source of income for most disabled-worker beneficiaries. About 80 percent of beneficiaries get at least half of their income from Social Security, including the 37 percent of beneficiaries who rely on DI benefits as their sole source of income (Bailey and Hemmeter forthcoming).
The average disabled-worker benefit of $13,985 a year is slightly more than the federal poverty threshold ($12,316) for a working-age person living alone. The average benefit for families with a disabled worker and one or more dependent children who are also receiving benefits is $21,463 a year, slightly above the poverty threshold ($19,073) for a family of three (SSA n.d. b).
DI Beneficiaries Reflect the Changing Composition of the American Workforce
In recent decades, as more women have joined the paid work force and earned disability protection through Social Security, they have accounted for an increasing share of DI participants. In December 2013, women accounted for nearly half (48 percent) of disabled-worker beneficiaries (SSA 2014, Table 19).
According to SSA's 2010 National Beneficiary Survey (NBS), 75 percent of disabled workers identify as white or Caucasian, 18 percent identify as black or African American, and 7 percent identify as another racial group or multiple groups. By ethnicity, 11 percent of disabled workers identify as Hispanic.
Nearly one million veterans of the armed forces receive Social Security disabled-worker benefits. Veterans account for one in nine of these beneficiaries (Bailey and Hemmeter forthcoming).
DI beneficiaries have varied educational backgrounds. The lower bar in Chart 3 shows educational attainment for disabled-worker beneficiaries based on the 2013 Survey of Income and Program Participation (SIPP), the most recent data available (Bailey and Hemmeter, forthcoming). These data show that about half of disabled-worker beneficiaries have formal education beyond high school, including 18 percent who have at least a 4-year college degree. They also show that about 12 percent of disabled-worker beneficiaries did not obtain a high school diploma or the General Educational Development (GED) equivalent.
Percentage distribution of DI disabled-worker beneficiaries, by educational attainment based on data from NBS (2010) and SIPP (2013)
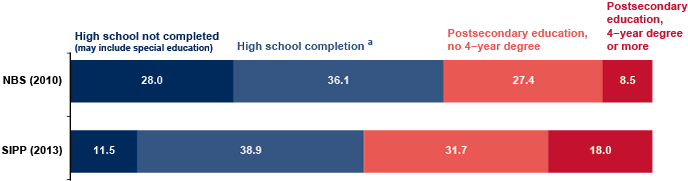
| Educational attainment | NBS (2010) | SIPP (2013) |
|---|---|---|
| High school not completed (may include special education) | 28.0 | 11.5 |
| High school completion a | 36.1 | 38.9 |
| Postsecondary education, no 4-year degree | 27.4 | 31.7 |
| Postsecondary education, 4-year degree or more | 8.5 | 18.0 |
Another dataset, SSA's 2010 NBS, suggests somewhat different educational outcomes for disabled-worker beneficiaries (the upper bar in Chart 3). Although the NBS and SIPP data are similar for high school completion and postsecondary education without a 4-year degree, the NBS results indicate that only about 9 percent of disabled-worker beneficiaries had at least a 4-year college degree and that 28 percent had less than a high school education.
Although further research needs to be done to understand the reasons for these differences, it is worth noting that changes in the SIPP data over time may reflect changes in the educational levels of the U.S. population as a whole. In general, education levels have been increasing over time, and high school dropout rates have been falling (Chapman and others 2011; Census Bureau 2015, Table A-1). Consistent with those changes, SIPP data indicate a decrease in the proportion of disabled-worker beneficiaries with less than a high school education, from 23 percent in 2002 to 16 percent in 2010 and 12 percent in 2013 (Bailey and Hemmeter 2014; DeCesaro and Hemmeter 2008). Still, the magnitude of these changes over a relatively short time is surprising, and they differ from the 2010 NBS findings, which are closer to the 2002 SIPP results. New NBS data for 2015 will be available in 2016 and should shed additional light on changes over time in the educational attainment of disabled-worker beneficiaries.
Conclusion
The Social Security DI program was designed to provide modest federal benefits to workers with established work histories who had paid into the program and subsequently became totally disabled and unable to support themselves through work. Current data on the DI disabled-worker beneficiary population indicate that the program hews closely to this intent. Beneficiaries generally had long work histories before becoming eligible for DI. Most beneficiaries not only met the minimum insured-status requirements, but handily exceeded them, often earning the maximum possible work credits in all (or nearly all) years between age 21 and DI eligibility. Their patterns of predisability employment by industry were much like those of nondisabled workers, and prior to starting DI benefits, they had achieved adjusted earnings in their top 5 earnings years that, on average, were comparable to the 2014 earnings of nondisabled workers.
As the DI program's designers intended, most disabled-worker beneficiaries are older; the majority of them are aged 50 or older when they start receiving benefits. The program's strict eligibility standards are reflected in the high mortality rate among beneficiaries within 5 years of starting benefits. Its goal of providing only the most basic of benefits is reflected in the fact that the average benefit level remains less than one-third of the national AWI and only slightly above the federal poverty line.
Although the Social Security DI program has grown and adjusted to meet the demographic changes in the United States since 1956, it also succeeds in dutifully following the core tenets that Congress established for it nearly 60 years ago.
Notes
1 For a legislative history of DI program developments 1935–1974, see House Ways and Means Committee (1974).
2 See, for example, the many evaluations of return-to-work services provided under the Ticket to Work program at https://www.socialsecurity.gov/disabilityresearch/twe_reports.htm.
3 A spouse's eligibility is typically tied to care of children, although other circumstances may allow a spouse to qualify.
4 Since 1978, work credits (still known as “quarters of coverage”) have been based on annual earnings, without regard to when the work occurred during the year. Workers can earn a maximum of four quarters of coverage each calendar year. For example, in 2014, workers who earned at least $1,200, $2,400, $3,600, or $4,800 respectively earned one, two, three, or four work credits for the year.
5 We use the 2014 AWI—as reported in Board of Trustees (2014)—to adjust the earnings data for each beneficiary. Some analysts assert that wage indexing artificially inflates past earnings. If so, the effect is greater for earnings from earlier periods. We analyzed annual earnings for the 5 years with the highest earnings during the pre-DI working lifetime of each disabled-worker beneficiary in our dataset; the average calendar year for those data points was 1992. Because 1992 is relatively recent, we do not consider potential distortion to be a significant concern.
References
Bailey, Michelle Stegman, and Jeffrey Hemmeter. 2014. “Characteristics of Noninstitutionalized DI and SSI Program Participants, 2010 Update.” Research and Statistics Note No. 2014-02. Washington, DC: SSA, Office of Retirement and Disability Policy. https://www.socialsecurity.gov/policy/docs/rsnotes/rsn2014-02.html.
———. Forthcoming. “Social Security Administrative Records Matched to 2008 SIPP Wave 15 (2013) Data.”
[Board of Trustees] Board of Trustees of the Federal Old-Age and Survivors Insurance and Federal Disability Insurance Trust Funds. 2014. 2014 Annual Report of the Board of Trustees of the Federal Old-Age and Survivors Insurance and Federal Disability Insurance Trust Funds. https://www.socialsecurity.gov/oact/tr/2014/tr2014.pdf.
Bureau of Labor Statistics. 2013. “Employment Projections: Employment by Industry Sector.” http://www.bls.gov/emp/ep_table_201.htm.
Census Bureau. 2015. “Educational Attainment: CPS Historical Time Series Tables.” http://www.census.gov/hhes/socdemo/education/data/cps/historical/.
Chapman, Chris, Jennifer Laird, Nicole Ifill, and Angelina KewalRamani. 2011. Trends in High School Dropout and Completion Rates in the United States: 1972–2009. Compendium Report. NCES 2012-006. Washington, DC: Department of Education, National Center for Education Statistics. https://nces.ed.gov/pubs2012/2012006.pdf.
DeCesaro, Anne, and Jeffrey Hemmeter. 2008. “Characteristics of Noninstitutionalized DI and SSI Program Participants.” Research and Statistics Note No. 2008-02. Washington, DC: SSA, Office of Policy. https://www.socialsecurity.gov/policy/docs/rsnotes/rsn2008-02.html.
House Ways and Means Committee. See U.S. Congress, House Committee on Ways and Means.
[OECD] Organisation for Economic Co-operation and Development. 2010. Sickness, Disability, and Work: Breaking the Barriers. A Synthesis of Findings Across OECD Countries. Paris: OECD Publishing. http://ec.europa.eu/health/mental_health/eu_compass/reports_studies/disability_synthesis_2010_en.pdf.
[SSA] Social Security Administration. 2014. Annual Statistical Report on the Social Security Disability Insurance Program, 2013. SSA Publication No. 13-11826. https://www.socialsecurity.gov/policy/docs/statcomps/di_asr/2013/index.html.
———. n.d. a. “Benefits Paid by Type of Beneficiary.” SSA, Office of the Chief Actuary. https://www.socialsecurity.gov/OACT/ProgData/icp.html.
———. n.d. b. “Benefits Paid by Type of Family.” SSA, Office of the Chief Actuary. https://www.socialsecurity.gov/OACT/ProgData/famben.html.
U.S. Congress, House Committee on Ways and Means. 1935. The Social Security Bill. Committee Report No. 615. Washington, DC: Government Printing Office. https://www.socialsecurity.gov/history/reports/35housereport.html.
———. 1974. Committee Staff Report on the Disability Insurance Program. Washington, DC: Government Printing Office. https://www.socialsecurity.gov/history/pdf/dibreport.pdf.
Zayatz, Tim. 2011. “Social Security Disability Insurance Program Worker Experience.” Actuarial Study No. 122. SSA, Office of the Chief Actuary. https://www.socialsecurity.gov/OACT/NOTES/pdf_studies/study122.pdf.