Annual Statistical Report on the Social Security Disability Insurance Program, 2025
Outcomes of Applications for Disability Benefits
The tables in this section provide statistics on the outcomes of applications for disability benefits. The statistics on applications are derived from the Social Security Administration's (SSA's) Disability Research File. Each year this file is updated with information about applications for disability benefits that is then used to determine the outcome of those applications. The outcome statistics in these tables are reported by year of filing and include decisions made through the conclusion of the administrative appeals process.
Table 60 shows the total number of applications filed in a year, the number that are pending a final decision, the number denied for nonmedical reasons before a medical decision is made (technical denials), the outcome of applications for which a medical allowance or denial was made, and award and allowance rates. Applications for which a medical allowance or denial decision was made but which were subsequently denied for nonmedical reasons are shown under the medical decision header as subsequent denials. The most common nonmedical reason for denying a claim is insufficient number of recent quarters of coverage.
The allowance rate is calculated by dividing the number of medical allowances (including subsequent technical denials) by the total number of medical decisions made for a 1-year cohort. The award rate is a broader program measure that is calculated as the number of allowances minus subsequent denials divided by total applications (minus pending claims) filed for a given year. For more recent years, the award and allowance rates will change as decisions are made on pending claims.
Tables 61–63 show the allowance rate for Social Security only and the Social Security portion of concurrent applications (which are claims for both Social Security and Supplemental Security Income disability benefits). Each table shows a different level in the administrative decision-making process; that is, initial adjudicative, reconsideration, and hearing level or above.
From October 1999 through March 2020, the proportion of claims awarded at each level of the process was affected by a prototype process that SSA tested in 10 states. Under this test, the reconsideration step of the appeals process was eliminated for applications filed October 1, 1999, or later. Elimination of the reconsideration level in these states resulted in a decrease in the aggregate proportion of claims awarded at this step. SSA began phasing out the prototype process on January 1, 2019, and by March 31, 2020, the reconsideration step had been reinstated in all 10 test states.
This section also includes one table that shows the reason for medical allowance and one that shows the reason for medical denial (Tables 64 and 65). The reasons are derived from the sequential evaluation process used by decision makers. SSA maintains a list of impairments that are considered disabling under its regulations. An applicant can be found to be disabled if he or she—
- has a listed impairment,
- has a severe impairment that is equal to a listed impairment,
- has a severe impairment when medical and vocational factors are considered, or
- had previously established entitlement to a disability benefit.
An applicant can be denied benefits if he or she—
- has an impairment that is not expected to last 12 months,
- has an impairment that is not considered severe,
- is able to perform his or her usual type of work, or
- is able to perform another type of work.
Other denial reasons include impairment resulting from drug addiction or alcoholism, insufficient medical evidence, failure to cooperate, failure to follow prescribed treatment, not continuing development of the claim, and returns to substantial work before disability can be established.
The final award rate for disabled-worker applicants has varied over time, averaging 29 percent for claims filed from 2015 through 2024. The share of applicants awarded benefits at the initial claims level has ranged narrowly from 18 percent to 21 percent. The percentages of applicants awarded at the reconsideration and hearing levels have averaged 2 percent and 7 percent, respectively. Denied disability claims have averaged 68 percent.
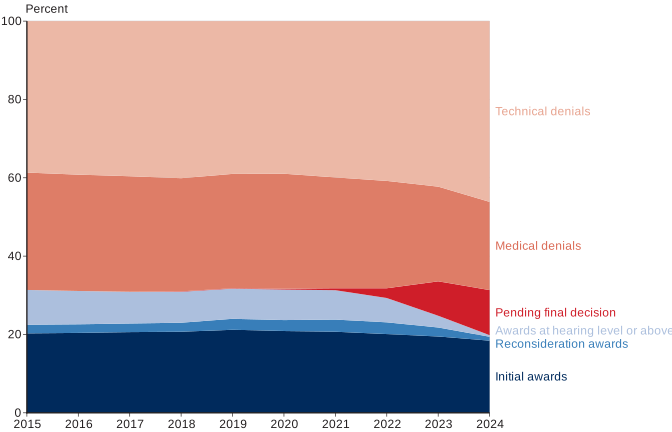
| Year | Initial awards | Reconsideration awards | Awards at hearing level or above | Pending final decision | Medical denials | Technical denials |
|---|---|---|---|---|---|---|
| 2015 | 20.3 | 2.2 | 8.9 | 0.0 | 30.0 | 38.7 |
| 2016 | 20.4 | 2.2 | 8.5 | 0.0 | 29.7 | 39.2 |
| 2017 | 20.6 | 2.2 | 8.1 | 0.0 | 29.5 | 39.6 |
| 2018 | 20.7 | 2.3 | 7.9 | 0.1 | 28.9 | 40.1 |
| 2019 | 21.2 | 2.8 | 7.7 | 0.1 | 29.2 | 39.0 |
| 2020 | 20.9 | 2.8 | 7.8 | 0.2 | 29.4 | 39.0 |
| 2021 | 20.7 | 3.1 | 7.5 | 0.5 | 28.3 | 39.9 |
| 2022 | 20.1 | 3.0 | 6.2 | 2.5 | 27.4 | 40.8 |
| 2023 | 19.5 | 2.3 | 3.0 | 8.8 | 24.2 | 42.3 |
| 2024 | 18.4 | 1.0 | 0.4 | 11.5 | 22.5 | 46.1 |
| Year | Total | Pending final decision | Technical denials a | Medical decisions | Award rate d (percent) | Allowance rate e (percent) | |||
|---|---|---|---|---|---|---|---|---|---|
| Denials | Allowances | ||||||||
| Medical | Subsequent nonmedical b | Awards | Subsequent denials c | ||||||
| All disabled beneficiaries | |||||||||
| 1999 | 1,265,037 | 0 | 104,332 | 445,995 | 4,056 | 708,797 | 1,857 | 56.0 | 61.3 |
| 2000 | 1,364,323 | 0 | 136,054 | 456,467 | 3,817 | 766,047 | 1,938 | 56.1 | 62.6 |
| 2001 | 1,513,411 | 0 | 170,520 | 496,835 | 3,579 | 840,542 | 1,935 | 55.5 | 62.8 |
| 2002 | 1,715,710 | 0 | 231,067 | 580,430 | 4,067 | 898,047 | 2,099 | 52.3 | 60.7 |
| 2003 | 1,941,894 | 0 | 374,305 | 632,284 | 4,485 | 928,747 | 2,073 | 47.8 | 59.5 |
| 2004 | 2,262,119 | 0 | 615,672 | 677,811 | 5,634 | 961,376 | 1,626 | 42.5 | 58.5 |
| 2005 | 2,087,733 | 0 | 528,760 | 642,170 | 6,964 | 907,877 | 1,962 | 43.5 | 58.4 |
| 2006 | 2,164,394 | 0 | 611,199 | 653,256 | 7,270 | 890,752 | 1,917 | 41.2 | 57.5 |
| 2007 | 2,216,565 | 0 | 651,753 | 641,811 | 7,914 | 913,269 | 1,818 | 41.2 | 58.5 |
| 2008 | 2,358,629 | 0 | 717,133 | 660,762 | 9,023 | 969,935 | 1,776 | 41.1 | 59.2 |
| 2009 | 2,753,012 | 0 | 845,192 | 789,506 | 10,686 | 1,105,781 | 1,847 | 40.2 | 58.1 |
| 2010 | 2,981,615 | 0 | 978,627 | 861,506 | 19,094 | 1,120,313 | 2,075 | 37.6 | 56.0 |
| 2011 | 2,952,112 | 0 | 981,930 | 872,759 | 20,762 | 1,074,600 | 2,061 | 36.4 | 54.6 |
| 2012 | 2,955,946 | 0 | 1,024,469 | 867,276 | 23,847 | 1,038,076 | 2,278 | 35.1 | 53.9 |
| 2013 | 2,790,688 | 0 | 971,035 | 827,002 | 24,972 | 965,434 | 2,245 | 34.6 | 53.2 |
| 2014 | 2,687,365 | 0 | 936,798 | 803,515 | 27,019 | 917,751 | 2,282 | 34.2 | 52.6 |
| 2015 | 2,547,682 | 0 | 904,231 | 760,578 | 27,501 | 853,073 | 2,299 | 33.5 | 52.0 |
| 2016 | 2,430,102 | 0 | 875,622 | 718,067 | 27,332 | 807,101 | 1,980 | 33.2 | 52.0 |
| 2017 | 2,306,264 | 0 | 834,113 | 677,828 | 28,079 | 764,311 | 1,933 | 33.1 | 52.0 |
| 2018 | 2,226,343 | 2,574 | 811,070 | 639,603 | 29,611 | 741,414 | 2,071 | 33.3 | 52.6 |
| 2019 | 2,183,466 | 2,458 | 774,996 | 639,911 | 28,516 | 735,710 | 1,875 | 33.7 | 52.5 |
| 2020 | 2,013,670 | 4,067 | 716,519 | 594,180 | 27,139 | 670,200 | 1,565 | 33.3 | 52.0 |
| 2021 | 2,005,440 | 10,012 | 733,951 | 569,452 | 27,132 | 663,421 | 1,472 | 33.2 | 52.7 |
| 2022 | 2,010,786 | 48,517 | 750,831 | 552,491 | 27,208 | 630,193 | 1,546 | 32.1 | 52.1 |
| 2023 | 2,096,685 | 177,505 | 811,751 | 509,435 | 30,001 | 566,389 | 1,604 | 29.5 | 51.3 |
| 2024 | 1,940,736 | 214,574 | 820,127 | 435,903 | 30,817 | 438,079 | 1,236 | 25.4 | 48.5 |
| Workers | |||||||||
| 1992 | 1,310,004 | 0 | 130,885 | 481,439 | 5,725 | 689,111 | 2,844 | 52.6 | 58.8 |
| 1993 | 1,384,501 | 0 | 140,314 | 540,906 | 5,626 | 695,007 | 2,648 | 50.2 | 56.2 |
| 1994 | 1,383,092 | 0 | 130,240 | 573,158 | 5,506 | 671,791 | 2,397 | 48.6 | 53.9 |
| 1995 | 1,301,472 | 0 | 123,711 | 542,097 | 5,048 | 628,380 | 2,236 | 48.3 | 53.6 |
| 1996 | 1,313,818 | 0 | 116,988 | 537,482 | 5,011 | 652,221 | 2,116 | 49.6 | 54.8 |
| 1997 | 1,164,680 | 0 | 106,868 | 449,464 | 4,212 | 602,277 | 1,859 | 51.7 | 57.2 |
| 1998 | 1,138,101 | 0 | 96,718 | 421,953 | 4,205 | 613,181 | 2,044 | 53.9 | 59.2 |
| 1999 | 1,167,650 | 0 | 102,305 | 419,486 | 4,008 | 640,065 | 1,786 | 54.8 | 60.3 |
| 2000 | 1,265,188 | 0 | 133,947 | 430,581 | 3,782 | 695,007 | 1,871 | 54.9 | 61.7 |
| 2001 | 1,414,524 | 0 | 168,231 | 470,999 | 3,537 | 769,877 | 1,880 | 54.4 | 62.0 |
| 2002 | 1,609,480 | 0 | 228,455 | 550,985 | 4,011 | 823,981 | 2,048 | 51.2 | 59.9 |
| 2003 | 1,831,154 | 0 | 371,334 | 599,558 | 4,428 | 853,832 | 2,002 | 46.6 | 58.7 |
| 2004 | 2,145,629 | 0 | 611,647 | 643,040 | 5,582 | 883,784 | 1,576 | 41.2 | 57.8 |
| 2005 | 1,970,277 | 0 | 524,858 | 607,568 | 6,874 | 829,087 | 1,890 | 42.1 | 57.6 |
| 2006 | 2,040,682 | 0 | 606,435 | 613,407 | 7,164 | 811,818 | 1,858 | 39.8 | 56.8 |
| 2007 | 2,083,897 | 0 | 646,511 | 599,001 | 7,799 | 828,834 | 1,752 | 39.8 | 57.8 |
| 2008 | 2,217,126 | 0 | 711,536 | 616,715 | 8,892 | 878,274 | 1,709 | 39.6 | 58.4 |
| 2009 | 2,595,028 | 0 | 839,206 | 737,312 | 10,538 | 1,006,200 | 1,772 | 38.8 | 57.4 |
| 2010 | 2,809,479 | 0 | 968,148 | 804,279 | 18,493 | 1,016,551 | 2,008 | 36.2 | 55.3 |
| 2011 | 2,780,981 | 0 | 971,069 | 815,997 | 20,268 | 971,651 | 1,996 | 34.9 | 53.8 |
| 2012 | 2,776,221 | 0 | 1,009,057 | 810,909 | 22,757 | 931,342 | 2,156 | 33.5 | 52.8 |
| 2013 | 2,620,315 | 0 | 958,204 | 773,665 | 24,012 | 862,286 | 2,148 | 32.9 | 52.0 |
| 2014 | 2,523,715 | 0 | 924,698 | 754,270 | 25,974 | 816,572 | 2,201 | 32.4 | 51.2 |
| 2015 | 2,383,373 | 0 | 892,521 | 714,073 | 26,452 | 748,126 | 2,201 | 31.4 | 50.3 |
| 2016 | 2,275,573 | 0 | 864,622 | 675,182 | 26,344 | 707,557 | 1,868 | 31.1 | 50.3 |
| 2017 | 2,153,539 | 0 | 823,492 | 636,277 | 27,069 | 664,862 | 1,839 | 30.9 | 50.1 |
| 2018 | 2,068,395 | 2,429 | 799,305 | 596,884 | 28,464 | 639,370 | 1,943 | 30.9 | 50.6 |
| 2019 | 2,028,572 | 2,322 | 762,281 | 591,338 | 27,103 | 643,857 | 1,671 | 31.8 | 51.1 |
| 2020 | 1,880,699 | 3,871 | 705,641 | 552,402 | 25,546 | 591,841 | 1,398 | 31.5 | 50.7 |
| 2021 | 1,878,310 | 9,694 | 723,001 | 531,331 | 25,545 | 587,441 | 1,298 | 31.4 | 51.4 |
| 2022 | 1,880,097 | 46,760 | 739,410 | 515,612 | 25,541 | 551,417 | 1,357 | 30.1 | 50.5 |
| 2023 | 1,957,398 | 171,925 | 797,875 | 473,831 | 28,200 | 484,159 | 1,408 | 27.1 | 49.2 |
| 2024 | 1,807,773 | 208,599 | 803,263 | 407,548 | 29,533 | 357,754 | 1,076 | 22.4 | 45.1 |
| Widow(er)s | |||||||||
| 1999 | 40,053 | 0 | 1,173 | 9,718 | 17 | 29,108 | 37 | 72.7 | 75.0 |
| 2000 | 39,990 | 0 | 1,258 | 9,013 | 11 | 29,679 | 29 | 74.2 | 76.8 |
| 2001 | 40,227 | 0 | 1,344 | 8,738 | 13 | 30,113 | 19 | 74.9 | 77.5 |
| 2002 | 41,065 | 0 | 1,540 | 8,941 | 18 | 30,547 | 19 | 74.4 | 77.4 |
| 2003 | 41,243 | 0 | 1,645 | 9,553 | 24 | 29,977 | 44 | 72.7 | 75.9 |
| 2004 | 42,449 | 0 | 2,069 | 9,554 | 22 | 30,780 | 24 | 72.5 | 76.3 |
| 2005 | 41,409 | 0 | 1,892 | 9,253 | 26 | 30,215 | 23 | 73.0 | 76.6 |
| 2006 | 41,468 | 0 | 2,190 | 9,774 | 38 | 29,443 | 23 | 71.0 | 75.1 |
| 2007 | 40,781 | 0 | 2,211 | 8,975 | 28 | 29,540 | 27 | 72.4 | 76.7 |
| 2008 | 42,140 | 0 | 2,329 | 8,622 | 31 | 31,137 | 21 | 73.9 | 78.3 |
| 2009 | 44,059 | 0 | 2,551 | 8,943 | 43 | 32,502 | 20 | 73.8 | 78.4 |
| 2010 | 47,583 | 0 | 3,543 | 9,707 | 82 | 34,228 | 23 | 71.9 | 77.8 |
| 2011 | 47,030 | 0 | 3,498 | 9,835 | 74 | 33,589 | 34 | 71.4 | 77.2 |
| 2012 | 51,363 | 0 | 5,850 | 9,901 | 242 | 35,317 | 53 | 68.8 | 77.7 |
| 2013 | 49,596 | 0 | 5,109 | 9,990 | 261 | 34,193 | 43 | 68.9 | 77.0 |
| 2014 | 48,057 | 0 | 4,620 | 9,683 | 266 | 33,451 | 37 | 69.6 | 77.1 |
| 2015 | 45,845 | 0 | 4,464 | 8,881 | 289 | 32,174 | 37 | 70.2 | 77.8 |
| 2016 | 43,054 | 0 | 4,110 | 8,236 | 249 | 30,417 | 42 | 70.6 | 78.2 |
| 2017 | 41,000 | 0 | 3,839 | 7,804 | 284 | 29,042 | 31 | 70.8 | 78.2 |
| 2018 | 39,451 | 33 | 3,936 | 7,802 | 322 | 27,316 | 42 | 69.3 | 77.1 |
| 2019 | 39,429 | 33 | 4,429 | 9,414 | 440 | 25,044 | 69 | 63.6 | 71.8 |
| 2020 | 36,216 | 54 | 3,970 | 8,747 | 624 | 22,758 | 63 | 62.9 | 70.9 |
| 2021 | 35,302 | 69 | 4,038 | 8,517 | 630 | 21,977 | 71 | 62.4 | 70.7 |
| 2022 | 32,810 | 473 | 4,069 | 7,616 | 689 | 19,878 | 85 | 61.5 | 70.6 |
| 2023 | 29,420 | 1,575 | 4,355 | 6,000 | 648 | 16,785 | 57 | 60.3 | 71.7 |
| 2024 | 23,582 | 1,509 | 4,039 | 4,054 | 494 | 13,451 | 35 | 60.9 | 74.8 |
| Adult children | |||||||||
| 1999 | 57,334 | 0 | 854 | 16,791 | 31 | 39,624 | 34 | 69.1 | 70.3 |
| 2000 | 59,145 | 0 | 849 | 16,873 | 24 | 41,361 | 38 | 69.9 | 71.1 |
| 2001 | 58,660 | 0 | 945 | 17,098 | 29 | 40,552 | 36 | 69.1 | 70.4 |
| 2002 | 65,165 | 0 | 1,072 | 20,504 | 38 | 43,519 | 32 | 66.8 | 68.0 |
| 2003 | 69,497 | 0 | 1,326 | 23,173 | 33 | 44,938 | 27 | 64.7 | 66.0 |
| 2004 | 74,041 | 0 | 1,956 | 25,217 | 30 | 46,812 | 26 | 63.2 | 65.0 |
| 2005 | 76,047 | 0 | 2,010 | 25,349 | 64 | 48,575 | 49 | 63.9 | 65.7 |
| 2006 | 82,244 | 0 | 2,574 | 30,075 | 68 | 49,491 | 36 | 60.2 | 62.2 |
| 2007 | 91,887 | 0 | 3,031 | 33,835 | 87 | 54,895 | 39 | 59.7 | 61.8 |
| 2008 | 99,363 | 0 | 3,268 | 35,425 | 100 | 60,524 | 46 | 60.9 | 63.0 |
| 2009 | 113,925 | 0 | 3,435 | 43,251 | 105 | 67,079 | 55 | 58.9 | 60.8 |
| 2010 | 124,553 | 0 | 6,936 | 47,520 | 519 | 69,534 | 44 | 55.8 | 59.2 |
| 2011 | 124,101 | 0 | 7,363 | 46,927 | 420 | 69,360 | 31 | 55.9 | 59.4 |
| 2012 | 128,362 | 0 | 9,562 | 46,466 | 848 | 71,417 | 69 | 55.6 | 60.2 |
| 2013 | 120,777 | 0 | 7,722 | 43,347 | 699 | 68,955 | 54 | 57.1 | 61.0 |
| 2014 | 115,593 | 0 | 7,480 | 39,562 | 779 | 67,728 | 44 | 58.6 | 62.7 |
| 2015 | 118,464 | 0 | 7,246 | 37,624 | 760 | 72,773 | 61 | 61.4 | 65.5 |
| 2016 | 111,475 | 0 | 6,890 | 34,649 | 739 | 69,127 | 70 | 62.0 | 66.2 |
| 2017 | 111,725 | 0 | 6,782 | 33,747 | 726 | 70,407 | 63 | 63.0 | 67.2 |
| 2018 | 118,497 | 112 | 7,829 | 34,917 | 825 | 74,728 | 86 | 63.1 | 67.7 |
| 2019 | 115,465 | 103 | 8,286 | 39,159 | 973 | 66,809 | 135 | 57.9 | 62.5 |
| 2020 | 96,755 | 142 | 6,908 | 33,031 | 969 | 55,601 | 104 | 57.6 | 62.1 |
| 2021 | 91,828 | 249 | 6,912 | 29,604 | 957 | 54,003 | 103 | 59.0 | 63.9 |
| 2022 | 97,879 | 1,284 | 7,352 | 29,263 | 978 | 58,898 | 104 | 61.0 | 66.1 |
| 2023 | 109,867 | 4,005 | 9,521 | 29,604 | 1,153 | 65,445 | 139 | 61.8 | 68.1 |
| 2024 | 109,381 | 4,466 | 12,825 | 24,301 | 790 | 66,874 | 125 | 63.7 | 72.8 |
| SOURCE: Social Security Administration, Disability Research File, 100 percent data. | |||||||||
| NOTES: Data are current through June 2025 for the initial and reconsideration levels and through July 2025 for the hearing level or above. | |||||||||
| Because a number of applications remain pending for more recent years, the award and allowance rates will change over time. Cases can be pending at the initial or appellate levels and can include either medical or technical issues. | |||||||||
| Data include decisions for Social Security–only applications and applications for both Social Security and Supplemental Security Income (SSI); they do not include SSI-only applications. | |||||||||
| Data from 1992 through 1998 are available for disabled workers only. | |||||||||
| a. Applications were denied for nonmedical reasons; therefore no decision was made on severity of impairment. | |||||||||
| b. Applications were denied for nonmedical reasons after a decision was made that the applicant did not meet the medical severity criteria for disability benefits. | |||||||||
| c. Applications were denied for nonmedical reasons after a decision was made that the applicant met the medical severity criteria for disability benefits. | |||||||||
| d. Rate determined by dividing awards by all applications minus pending claims for that year. | |||||||||
| e. Rate determined by dividing medical allowances by all medical decisions for that year. | |||||||||
| CONTACT: statistics@ssa.gov. | |||||||||
| Year | All decisions | Decisions on applications for Social Security only | Decisions on applications for both Social Security and SSI | ||||||
|---|---|---|---|---|---|---|---|---|---|
| Total | Allowances | Allowance rate a (percent) | Total | Allowances | Allowance rate a (percent) | Total | Allowances | Allowance rate a,b (percent) | |
| All disabled beneficiaries | |||||||||
| 1999 | 1,160,792 | 458,854 | 39.5 | 649,980 | 313,152 | 48.2 | 510,812 | 145,702 | 28.5 |
| 2000 | 1,228,301 | 500,657 | 40.8 | 688,282 | 339,764 | 49.4 | 540,019 | 160,893 | 29.8 |
| 2001 | 1,342,915 | 558,741 | 41.6 | 742,869 | 379,266 | 51.1 | 600,046 | 179,475 | 29.9 |
| 2002 | 1,484,685 | 575,089 | 38.7 | 794,839 | 385,453 | 48.5 | 689,846 | 189,636 | 27.5 |
| 2003 | 1,567,607 | 583,758 | 37.2 | 804,688 | 383,225 | 47.6 | 762,919 | 200,533 | 26.3 |
| 2004 | 1,646,469 | 604,176 | 36.7 | 814,157 | 389,190 | 47.8 | 832,312 | 214,986 | 25.8 |
| 2005 | 1,559,003 | 575,310 | 36.9 | 763,377 | 370,449 | 48.5 | 795,626 | 204,861 | 25.7 |
| 2006 | 1,553,228 | 562,208 | 36.2 | 753,222 | 363,226 | 48.2 | 800,006 | 198,982 | 24.9 |
| 2007 | 1,564,868 | 583,058 | 37.3 | 757,294 | 377,352 | 49.8 | 807,574 | 205,706 | 25.5 |
| 2008 | 1,641,539 | 635,422 | 38.7 | 783,521 | 408,893 | 52.2 | 858,018 | 226,529 | 26.4 |
| 2009 | 1,907,857 | 734,410 | 38.5 | 922,365 | 480,888 | 52.1 | 985,492 | 253,522 | 25.7 |
| 2010 | 2,003,031 | 739,092 | 36.9 | 991,011 | 496,238 | 50.1 | 1,012,020 | 242,854 | 24.0 |
| 2011 | 1,970,235 | 703,312 | 35.7 | 988,039 | 478,747 | 48.5 | 982,196 | 224,565 | 22.9 |
| 2012 | 1,931,564 | 689,229 | 35.7 | 989,723 | 474,891 | 48.0 | 941,841 | 214,338 | 22.8 |
| 2013 | 1,819,732 | 643,402 | 35.4 | 966,567 | 450,234 | 46.6 | 853,165 | 193,168 | 22.6 |
| 2014 | 1,750,650 | 615,913 | 35.2 | 981,629 | 442,014 | 45.0 | 769,021 | 173,899 | 22.6 |
| 2015 | 1,643,545 | 583,185 | 35.5 | 941,447 | 424,195 | 45.1 | 702,098 | 158,990 | 22.6 |
| 2016 | 1,554,565 | 557,856 | 35.9 | 904,483 | 407,920 | 45.1 | 650,082 | 149,936 | 23.1 |
| 2017 | 1,472,259 | 538,885 | 36.6 | 855,383 | 393,819 | 46.0 | 616,876 | 145,066 | 23.5 |
| 2018 | 1,415,376 | 524,224 | 37.0 | 830,975 | 382,494 | 46.0 | 584,401 | 141,730 | 24.3 |
| 2019 | 1,408,623 | 515,058 | 36.6 | 810,396 | 367,838 | 45.4 | 598,227 | 147,220 | 24.6 |
| 2020 | 1,297,346 | 466,115 | 35.9 | 787,538 | 343,440 | 43.6 | 509,808 | 122,675 | 24.1 |
| 2021 | 1,271,813 | 459,815 | 36.2 | 796,090 | 341,375 | 42.9 | 475,723 | 118,440 | 24.9 |
| 2022 | 1,260,108 | 452,155 | 35.9 | 780,496 | 333,785 | 42.8 | 479,612 | 118,370 | 24.7 |
| 2023 | 1,281,920 | 461,173 | 36.0 | 783,428 | 340,790 | 43.5 | 498,492 | 120,383 | 24.1 |
| 2024 | 1,105,785 | 413,238 | 37.4 | 694,682 | 316,002 | 45.5 | 411,103 | 97,236 | 23.7 |
| Workers | |||||||||
| 1992 | 1,179,119 | 436,715 | 37.0 | 558,741 | 248,385 | 44.5 | 620,378 | 188,330 | 30.4 |
| 1993 | 1,244,187 | 421,560 | 33.9 | 571,464 | 240,839 | 42.1 | 672,723 | 180,721 | 26.9 |
| 1994 | 1,252,852 | 390,785 | 31.2 | 591,408 | 233,059 | 39.4 | 661,444 | 157,726 | 23.8 |
| 1995 | 1,177,761 | 367,293 | 31.2 | 569,963 | 223,457 | 39.2 | 607,798 | 143,836 | 23.7 |
| 1996 | 1,196,830 | 384,167 | 32.1 | 593,992 | 237,474 | 40.0 | 602,838 | 146,693 | 24.3 |
| 1997 | 1,057,812 | 357,880 | 33.8 | 551,909 | 228,793 | 41.5 | 505,903 | 129,087 | 25.5 |
| 1998 | 1,041,383 | 374,376 | 35.9 | 550,794 | 238,989 | 43.4 | 490,589 | 135,387 | 27.6 |
| 1999 | 1,065,430 | 396,253 | 37.2 | 578,884 | 259,417 | 44.8 | 486,546 | 136,836 | 28.1 |
| 2000 | 1,131,273 | 435,416 | 38.5 | 615,507 | 283,906 | 46.1 | 515,766 | 151,510 | 29.4 |
| 2001 | 1,246,317 | 493,638 | 39.6 | 670,621 | 323,649 | 48.3 | 575,696 | 169,989 | 29.5 |
| 2002 | 1,381,065 | 507,031 | 36.7 | 718,611 | 327,294 | 45.5 | 662,454 | 179,737 | 27.1 |
| 2003 | 1,459,838 | 514,871 | 35.3 | 728,169 | 324,769 | 44.6 | 731,669 | 190,102 | 26.0 |
| 2004 | 1,534,004 | 532,860 | 34.7 | 738,167 | 329,980 | 44.7 | 795,837 | 202,880 | 25.5 |
| 2005 | 1,445,449 | 502,762 | 34.8 | 686,143 | 309,900 | 45.2 | 759,306 | 192,862 | 25.4 |
| 2006 | 1,434,280 | 489,529 | 34.1 | 675,523 | 303,051 | 44.9 | 758,757 | 186,478 | 24.6 |
| 2007 | 1,437,440 | 505,946 | 35.2 | 676,179 | 314,355 | 46.5 | 761,261 | 191,591 | 25.2 |
| 2008 | 1,505,630 | 552,705 | 36.7 | 697,893 | 340,958 | 48.9 | 807,737 | 211,747 | 26.2 |
| 2009 | 1,755,858 | 644,692 | 36.7 | 830,777 | 407,867 | 49.1 | 925,081 | 236,825 | 25.6 |
| 2010 | 1,841,372 | 645,070 | 35.0 | 894,519 | 419,068 | 46.8 | 946,853 | 226,002 | 23.9 |
| 2011 | 1,809,962 | 610,298 | 33.7 | 890,729 | 401,279 | 45.1 | 919,233 | 209,019 | 22.7 |
| 2012 | 1,767,240 | 592,522 | 33.5 | 887,359 | 393,415 | 44.3 | 879,881 | 199,107 | 22.6 |
| 2013 | 1,662,181 | 549,540 | 33.1 | 867,271 | 370,747 | 42.7 | 794,910 | 178,793 | 22.5 |
| 2014 | 1,599,089 | 523,276 | 32.7 | 883,031 | 362,952 | 41.1 | 716,058 | 160,324 | 22.4 |
| 2015 | 1,490,938 | 486,165 | 32.6 | 838,850 | 340,416 | 40.6 | 652,088 | 145,749 | 22.4 |
| 2016 | 1,411,029 | 465,781 | 33.0 | 806,819 | 328,503 | 40.7 | 604,210 | 137,278 | 22.7 |
| 2017 | 1,330,146 | 446,449 | 33.6 | 756,810 | 313,463 | 41.4 | 573,336 | 132,986 | 23.2 |
| 2018 | 1,269,180 | 429,571 | 33.8 | 727,015 | 300,282 | 41.3 | 542,165 | 129,289 | 23.8 |
| 2019 | 1,266,431 | 431,556 | 34.1 | 709,938 | 296,861 | 41.8 | 556,493 | 134,695 | 24.2 |
| 2020 | 1,175,238 | 394,826 | 33.6 | 698,914 | 281,887 | 40.3 | 476,324 | 112,939 | 23.7 |
| 2021 | 1,155,614 | 390,492 | 33.8 | 711,127 | 281,769 | 39.6 | 444,487 | 108,723 | 24.5 |
| 2022 | 1,140,830 | 379,698 | 33.3 | 694,397 | 271,904 | 39.2 | 446,433 | 107,794 | 24.1 |
| 2023 | 1,156,648 | 382,754 | 33.1 | 694,792 | 273,862 | 39.4 | 461,856 | 108,892 | 23.6 |
| 2024 | 990,087 | 333,802 | 33.7 | 608,000 | 245,295 | 40.3 | 382,087 | 88,507 | 23.2 |
| Widow(er)s | |||||||||
| 1999 | 38,880 | 24,898 | 64.0 | 29,600 | 21,272 | 71.9 | 9,280 | 3,626 | 39.1 |
| 2000 | 38,732 | 25,748 | 66.5 | 29,874 | 21,967 | 73.5 | 8,858 | 3,781 | 42.7 |
| 2001 | 38,883 | 26,206 | 67.4 | 30,273 | 22,436 | 74.1 | 8,610 | 3,770 | 43.8 |
| 2002 | 39,526 | 26,489 | 67.0 | 30,891 | 22,751 | 73.6 | 8,635 | 3,738 | 43.3 |
| 2003 | 39,598 | 25,960 | 65.6 | 30,216 | 22,213 | 73.5 | 9,382 | 3,747 | 39.9 |
| 2004 | 40,380 | 26,666 | 66.0 | 29,578 | 22,252 | 75.2 | 10,802 | 4,414 | 40.9 |
| 2005 | 39,517 | 26,265 | 66.5 | 29,201 | 22,023 | 75.4 | 10,316 | 4,242 | 41.1 |
| 2006 | 39,278 | 25,584 | 65.1 | 28,454 | 21,399 | 75.2 | 10,824 | 4,185 | 38.7 |
| 2007 | 38,570 | 25,546 | 66.2 | 27,586 | 21,181 | 76.8 | 10,984 | 4,365 | 39.7 |
| 2008 | 39,811 | 26,777 | 67.3 | 28,194 | 22,185 | 78.7 | 11,617 | 4,592 | 39.5 |
| 2009 | 41,508 | 27,815 | 67.0 | 28,929 | 22,797 | 78.8 | 12,579 | 5,018 | 39.9 |
| 2010 | 44,040 | 29,501 | 67.0 | 30,599 | 24,203 | 79.1 | 13,441 | 5,298 | 39.4 |
| 2011 | 43,532 | 28,700 | 65.9 | 30,393 | 23,803 | 78.3 | 13,139 | 4,897 | 37.3 |
| 2012 | 45,517 | 30,477 | 67.0 | 32,409 | 25,662 | 79.2 | 13,108 | 4,815 | 36.7 |
| 2013 | 44,490 | 29,538 | 66.4 | 31,760 | 25,014 | 78.8 | 12,730 | 4,524 | 35.5 |
| 2014 | 43,441 | 28,997 | 66.8 | 31,412 | 24,794 | 78.9 | 12,029 | 4,203 | 34.9 |
| 2015 | 41,383 | 28,186 | 68.1 | 30,288 | 24,240 | 80.0 | 11,095 | 3,946 | 35.6 |
| 2016 | 38,946 | 26,718 | 68.6 | 28,743 | 23,041 | 80.2 | 10,203 | 3,677 | 36.0 |
| 2017 | 37,162 | 25,750 | 69.3 | 27,680 | 22,374 | 80.8 | 9,482 | 3,376 | 35.6 |
| 2018 | 35,519 | 23,968 | 67.5 | 26,524 | 20,703 | 78.1 | 8,995 | 3,265 | 36.3 |
| 2019 | 35,003 | 21,162 | 60.5 | 26,018 | 17,796 | 68.4 | 8,985 | 3,366 | 37.5 |
| 2020 | 32,252 | 19,311 | 59.9 | 24,291 | 16,353 | 67.3 | 7,961 | 2,958 | 37.2 |
| 2021 | 31,267 | 18,846 | 60.3 | 23,886 | 16,059 | 67.2 | 7,381 | 2,787 | 37.8 |
| 2022 | 28,745 | 17,054 | 59.3 | 21,442 | 14,294 | 66.7 | 7,303 | 2,760 | 37.8 |
| 2023 | 25,035 | 15,226 | 60.8 | 17,847 | 12,364 | 69.3 | 7,188 | 2,862 | 39.8 |
| 2024 | 19,469 | 13,124 | 67.4 | 14,481 | 11,130 | 76.9 | 4,988 | 1,994 | 40.0 |
| Adult children | |||||||||
| 1999 | 56,482 | 37,703 | 66.8 | 41,496 | 32,463 | 78.2 | 14,986 | 5,240 | 35.0 |
| 2000 | 58,296 | 39,493 | 67.7 | 42,901 | 33,891 | 79.0 | 15,395 | 5,602 | 36.4 |
| 2001 | 57,715 | 38,897 | 67.4 | 41,975 | 33,181 | 79.0 | 15,740 | 5,716 | 36.3 |
| 2002 | 64,094 | 41,569 | 64.9 | 45,337 | 35,408 | 78.1 | 18,757 | 6,161 | 32.8 |
| 2003 | 68,171 | 42,927 | 63.0 | 46,303 | 36,243 | 78.3 | 21,868 | 6,684 | 30.6 |
| 2004 | 72,085 | 44,650 | 61.9 | 46,412 | 36,958 | 79.6 | 25,673 | 7,692 | 30.0 |
| 2005 | 74,037 | 46,283 | 62.5 | 48,033 | 38,526 | 80.2 | 26,004 | 7,757 | 29.8 |
| 2006 | 79,670 | 47,095 | 59.1 | 49,245 | 38,776 | 78.7 | 30,425 | 8,319 | 27.3 |
| 2007 | 88,858 | 51,566 | 58.0 | 53,529 | 41,816 | 78.1 | 35,329 | 9,750 | 27.6 |
| 2008 | 96,098 | 55,940 | 58.2 | 57,434 | 45,750 | 79.7 | 38,664 | 10,190 | 26.4 |
| 2009 | 110,491 | 61,903 | 56.0 | 62,659 | 50,224 | 80.2 | 47,832 | 11,679 | 24.4 |
| 2010 | 117,619 | 64,521 | 54.9 | 65,893 | 52,967 | 80.4 | 51,726 | 11,554 | 22.3 |
| 2011 | 116,741 | 64,314 | 55.1 | 66,917 | 53,665 | 80.2 | 49,824 | 10,649 | 21.4 |
| 2012 | 118,807 | 66,230 | 55.7 | 69,955 | 55,814 | 79.8 | 48,852 | 10,416 | 21.3 |
| 2013 | 113,061 | 64,324 | 56.9 | 67,536 | 54,473 | 80.7 | 45,525 | 9,851 | 21.6 |
| 2014 | 108,120 | 63,640 | 58.9 | 67,186 | 54,268 | 80.8 | 40,934 | 9,372 | 22.9 |
| 2015 | 111,224 | 68,834 | 61.9 | 72,309 | 59,539 | 82.3 | 38,915 | 9,295 | 23.9 |
| 2016 | 104,590 | 65,357 | 62.5 | 68,921 | 56,376 | 81.8 | 35,669 | 8,981 | 25.2 |
| 2017 | 104,951 | 66,686 | 63.5 | 70,893 | 57,982 | 81.8 | 34,058 | 8,704 | 25.6 |
| 2018 | 110,677 | 70,685 | 63.9 | 77,436 | 61,509 | 79.4 | 33,241 | 9,176 | 27.6 |
| 2019 | 107,189 | 62,340 | 58.2 | 74,440 | 53,181 | 71.4 | 32,749 | 9,159 | 28.0 |
| 2020 | 89,856 | 51,978 | 57.8 | 64,333 | 45,200 | 70.3 | 25,523 | 6,778 | 26.6 |
| 2021 | 84,932 | 50,477 | 59.4 | 61,077 | 43,547 | 71.3 | 23,855 | 6,930 | 29.1 |
| 2022 | 90,533 | 55,403 | 61.2 | 64,657 | 47,587 | 73.6 | 25,876 | 7,816 | 30.2 |
| 2023 | 100,237 | 63,193 | 63.0 | 70,789 | 54,564 | 77.1 | 29,448 | 8,629 | 29.3 |
| 2024 | 96,229 | 66,312 | 68.9 | 72,201 | 59,577 | 82.5 | 24,028 | 6,735 | 28.0 |
| SOURCE: Social Security Administration, Disability Research File, 100 percent data. | |||||||||
| NOTES: Data are current through June 2025. | |||||||||
| Because a number of applications remain pending for more recent years, the allowance rate will change over time. | |||||||||
| Applications with a medical decision may be pending a final nonmedical decision or be subsequently denied for nonmedical reasons. | |||||||||
| Data from 1992 through 1998 are available for disabled workers only. | |||||||||
| SSI = Supplemental Security Income. | |||||||||
| a. Rate determined by dividing medical allowances by all medical decisions for that year. | |||||||||
| b. Rate for the Social Security portion only. | |||||||||
| CONTACT: statistics@ssa.gov. | |||||||||
| Year | All decisions | Decisions on applications for Social Security only | Decisions on applications for both Social Security and SSI | ||||||
|---|---|---|---|---|---|---|---|---|---|
| Total | Allowances | Allowance rate a (percent) | Total | Allowances | Allowance rate a (percent) | Total | Allowances | Allowance rate a,b (percent) | |
| All disabled beneficiaries | |||||||||
| 1999 | 397,127 | 58,602 | 14.8 | 209,682 | 33,223 | 15.8 | 187,445 | 25,379 | 13.5 |
| 2000 | 407,758 | 55,631 | 13.6 | 214,965 | 31,473 | 14.6 | 192,793 | 24,158 | 12.5 |
| 2001 | 434,185 | 55,494 | 12.8 | 221,720 | 30,807 | 13.9 | 212,465 | 24,687 | 11.6 |
| 2002 | 502,441 | 57,460 | 11.4 | 249,822 | 31,212 | 12.5 | 252,619 | 26,248 | 10.4 |
| 2003 | 542,986 | 57,868 | 10.7 | 258,354 | 30,344 | 11.7 | 284,632 | 27,524 | 9.7 |
| 2004 | 558,632 | 57,363 | 10.3 | 255,283 | 29,169 | 11.4 | 303,349 | 28,194 | 9.3 |
| 2005 | 514,277 | 51,732 | 10.1 | 231,252 | 26,556 | 11.5 | 283,025 | 25,176 | 8.9 |
| 2006 | 514,442 | 51,156 | 9.9 | 227,921 | 26,078 | 11.4 | 286,521 | 25,078 | 8.8 |
| 2007 | 519,254 | 57,038 | 11.0 | 224,454 | 29,822 | 13.3 | 294,800 | 27,216 | 9.2 |
| 2008 | 546,426 | 59,255 | 10.8 | 222,900 | 29,954 | 13.4 | 323,526 | 29,301 | 9.1 |
| 2009 | 644,224 | 64,080 | 9.9 | 264,493 | 33,212 | 12.6 | 379,731 | 30,868 | 8.1 |
| 2010 | 706,098 | 63,198 | 9.0 | 299,847 | 34,300 | 11.4 | 406,251 | 28,898 | 7.1 |
| 2011 | 724,461 | 65,171 | 9.0 | 314,358 | 36,364 | 11.6 | 410,103 | 28,807 | 7.0 |
| 2012 | 714,132 | 62,482 | 8.7 | 316,739 | 34,918 | 11.0 | 397,393 | 27,564 | 6.9 |
| 2013 | 682,342 | 56,588 | 8.3 | 316,232 | 32,174 | 10.2 | 366,110 | 24,414 | 6.7 |
| 2014 | 644,204 | 56,315 | 8.7 | 316,538 | 33,518 | 10.6 | 327,666 | 22,797 | 7.0 |
| 2015 | 572,132 | 54,508 | 9.5 | 291,104 | 32,975 | 11.3 | 281,028 | 21,533 | 7.7 |
| 2016 | 530,760 | 52,100 | 9.8 | 275,134 | 32,110 | 11.7 | 255,626 | 19,990 | 7.8 |
| 2017 | 485,861 | 48,588 | 10.0 | 250,604 | 30,094 | 12.0 | 235,257 | 18,494 | 7.9 |
| 2018 | 463,951 | 50,278 | 10.8 | 240,873 | 31,360 | 13.0 | 223,078 | 18,918 | 8.5 |
| 2019 | 460,039 | 61,154 | 13.3 | 237,697 | 38,202 | 16.1 | 222,342 | 22,952 | 10.3 |
| 2020 | 423,360 | 55,232 | 13.0 | 233,616 | 35,535 | 15.2 | 189,744 | 19,697 | 10.4 |
| 2021 | 416,350 | 60,516 | 14.5 | 236,916 | 39,765 | 16.8 | 179,434 | 20,751 | 11.6 |
| 2022 | 411,825 | 58,894 | 14.3 | 228,465 | 37,936 | 16.6 | 183,360 | 20,958 | 11.4 |
| 2023 | 307,012 | 46,453 | 15.1 | 171,379 | 30,471 | 17.8 | 135,633 | 15,982 | 11.8 |
| 2024 | 150,137 | 19,176 | 12.8 | 87,581 | 13,106 | 15.0 | 62,556 | 6,070 | 9.7 |
| Workers | |||||||||
| 1992 | 419,798 | 53,881 | 12.8 | 190,594 | 25,352 | 13.3 | 229,204 | 28,529 | 12.4 |
| 1993 | 469,151 | 58,275 | 12.4 | 206,606 | 27,306 | 13.2 | 262,545 | 30,969 | 11.8 |
| 1994 | 489,731 | 62,757 | 12.8 | 226,013 | 31,468 | 13.9 | 263,718 | 31,289 | 11.9 |
| 1995 | 458,036 | 60,584 | 13.2 | 218,950 | 31,563 | 14.4 | 239,086 | 29,021 | 12.1 |
| 1996 | 464,582 | 65,466 | 14.1 | 226,333 | 33,596 | 14.8 | 238,249 | 31,870 | 13.4 |
| 1997 | 403,225 | 59,978 | 14.9 | 206,148 | 33,373 | 16.2 | 197,077 | 26,605 | 13.5 |
| 1998 | 384,997 | 61,742 | 16.0 | 199,292 | 34,043 | 17.1 | 185,705 | 27,699 | 14.9 |
| 1999 | 384,286 | 55,272 | 14.4 | 202,999 | 31,712 | 15.6 | 181,287 | 23,560 | 13.0 |
| 2000 | 396,216 | 52,794 | 13.3 | 208,638 | 30,189 | 14.5 | 187,578 | 22,605 | 12.1 |
| 2001 | 422,937 | 52,905 | 12.5 | 215,591 | 29,647 | 13.8 | 207,346 | 23,258 | 11.2 |
| 2002 | 489,974 | 54,974 | 11.2 | 243,259 | 30,157 | 12.4 | 246,715 | 24,817 | 10.1 |
| 2003 | 529,775 | 55,342 | 10.4 | 252,226 | 29,348 | 11.6 | 277,549 | 25,994 | 9.4 |
| 2004 | 545,180 | 54,527 | 10.0 | 249,568 | 28,202 | 11.3 | 295,612 | 26,325 | 8.9 |
| 2005 | 501,374 | 49,029 | 9.8 | 225,707 | 25,640 | 11.4 | 275,667 | 23,389 | 8.5 |
| 2006 | 500,913 | 48,406 | 9.7 | 222,465 | 25,256 | 11.4 | 278,448 | 23,150 | 8.3 |
| 2007 | 503,473 | 54,434 | 10.8 | 218,683 | 28,950 | 13.2 | 284,790 | 25,484 | 8.9 |
| 2008 | 527,774 | 56,838 | 10.8 | 216,971 | 29,111 | 13.4 | 310,803 | 27,727 | 8.9 |
| 2009 | 621,676 | 61,281 | 9.9 | 258,019 | 32,309 | 12.5 | 363,657 | 28,972 | 8.0 |
| 2010 | 681,806 | 60,435 | 8.9 | 293,218 | 33,392 | 11.4 | 388,588 | 27,043 | 7.0 |
| 2011 | 699,642 | 62,356 | 8.9 | 307,208 | 35,405 | 11.5 | 392,434 | 26,951 | 6.9 |
| 2012 | 688,205 | 59,760 | 8.7 | 309,055 | 33,982 | 11.0 | 379,150 | 25,778 | 6.8 |
| 2013 | 657,786 | 54,156 | 8.2 | 309,024 | 31,345 | 10.1 | 348,762 | 22,811 | 6.5 |
| 2014 | 621,979 | 53,977 | 8.7 | 309,650 | 32,721 | 10.6 | 312,329 | 21,256 | 6.8 |
| 2015 | 551,894 | 52,132 | 9.4 | 284,649 | 32,140 | 11.3 | 267,245 | 19,992 | 7.5 |
| 2016 | 512,176 | 49,904 | 9.7 | 268,960 | 31,318 | 11.6 | 243,216 | 18,586 | 7.6 |
| 2017 | 468,120 | 46,406 | 9.9 | 244,631 | 29,238 | 12.0 | 223,489 | 17,168 | 7.7 |
| 2018 | 445,972 | 47,748 | 10.7 | 234,053 | 30,171 | 12.9 | 211,919 | 17,577 | 8.3 |
| 2019 | 440,252 | 57,626 | 13.1 | 228,909 | 36,098 | 15.8 | 211,343 | 21,528 | 10.2 |
| 2020 | 406,824 | 52,454 | 12.9 | 226,058 | 33,944 | 15.0 | 180,766 | 18,510 | 10.2 |
| 2021 | 401,202 | 57,734 | 14.4 | 229,788 | 38,154 | 16.6 | 171,414 | 19,580 | 11.4 |
| 2022 | 396,228 | 55,889 | 14.1 | 221,812 | 36,286 | 16.4 | 174,416 | 19,603 | 11.2 |
| 2023 | 295,101 | 44,133 | 15.0 | 166,585 | 29,178 | 17.5 | 128,516 | 14,955 | 11.6 |
| 2024 | 145,040 | 18,347 | 12.6 | 85,528 | 12,657 | 14.8 | 59,512 | 5,690 | 9.6 |
| Widow(er)s | |||||||||
| 1999 | 7,125 | 1,962 | 27.5 | 4,114 | 895 | 21.8 | 3,011 | 1,067 | 35.4 |
| 2000 | 6,379 | 1,572 | 24.6 | 3,872 | 734 | 19.0 | 2,507 | 838 | 33.4 |
| 2001 | 6,212 | 1,582 | 25.5 | 3,865 | 728 | 18.8 | 2,347 | 854 | 36.4 |
| 2002 | 6,390 | 1,392 | 21.8 | 3,996 | 649 | 16.2 | 2,394 | 743 | 31.0 |
| 2003 | 6,665 | 1,378 | 20.7 | 3,832 | 637 | 16.6 | 2,833 | 741 | 26.2 |
| 2004 | 6,475 | 1,549 | 23.9 | 3,457 | 597 | 17.3 | 3,018 | 952 | 31.5 |
| 2005 | 6,105 | 1,381 | 22.6 | 3,329 | 561 | 16.9 | 2,776 | 820 | 29.5 |
| 2006 | 5,985 | 1,308 | 21.9 | 3,120 | 461 | 14.8 | 2,865 | 847 | 29.6 |
| 2007 | 5,948 | 1,144 | 19.2 | 2,887 | 462 | 16.0 | 3,061 | 682 | 22.3 |
| 2008 | 6,347 | 921 | 14.5 | 2,858 | 391 | 13.7 | 3,489 | 530 | 15.2 |
| 2009 | 6,988 | 1,077 | 15.4 | 3,044 | 446 | 14.7 | 3,944 | 631 | 16.0 |
| 2010 | 7,359 | 1,055 | 14.3 | 3,073 | 461 | 15.0 | 4,286 | 594 | 13.9 |
| 2011 | 7,861 | 1,133 | 14.4 | 3,373 | 505 | 15.0 | 4,488 | 628 | 14.0 |
| 2012 | 8,147 | 1,116 | 13.7 | 3,546 | 480 | 13.5 | 4,601 | 636 | 13.8 |
| 2013 | 8,101 | 1,029 | 12.7 | 3,485 | 457 | 13.1 | 4,616 | 572 | 12.4 |
| 2014 | 7,833 | 1,012 | 12.9 | 3,420 | 456 | 13.3 | 4,413 | 556 | 12.6 |
| 2015 | 6,923 | 981 | 14.2 | 3,032 | 424 | 14.0 | 3,891 | 557 | 14.3 |
| 2016 | 6,361 | 840 | 13.2 | 2,817 | 392 | 13.9 | 3,544 | 448 | 12.6 |
| 2017 | 5,761 | 803 | 13.9 | 2,548 | 396 | 15.5 | 3,213 | 407 | 12.7 |
| 2018 | 5,839 | 943 | 16.2 | 2,699 | 476 | 17.6 | 3,140 | 467 | 14.9 |
| 2019 | 6,486 | 1,483 | 22.9 | 3,423 | 912 | 26.6 | 3,063 | 571 | 18.6 |
| 2020 | 5,937 | 1,244 | 21.0 | 3,113 | 717 | 23.0 | 2,824 | 527 | 18.7 |
| 2021 | 5,418 | 1,258 | 23.2 | 2,984 | 769 | 25.8 | 2,434 | 489 | 20.1 |
| 2022 | 5,201 | 1,288 | 24.8 | 2,710 | 735 | 27.1 | 2,491 | 553 | 22.2 |
| 2023 | 3,390 | 905 | 26.7 | 1,722 | 506 | 29.4 | 1,668 | 399 | 23.9 |
| 2024 | 1,213 | 258 | 21.3 | 588 | 133 | 22.6 | 625 | 125 | 20.0 |
| Adult children | |||||||||
| 1999 | 5,716 | 1,368 | 23.9 | 2,569 | 616 | 24.0 | 3,147 | 752 | 23.9 |
| 2000 | 5,163 | 1,265 | 24.5 | 2,455 | 550 | 22.4 | 2,708 | 715 | 26.4 |
| 2001 | 5,036 | 1,007 | 20.0 | 2,264 | 432 | 19.1 | 2,772 | 575 | 20.7 |
| 2002 | 6,077 | 1,094 | 18.0 | 2,567 | 406 | 15.8 | 3,510 | 688 | 19.6 |
| 2003 | 6,546 | 1,148 | 17.5 | 2,296 | 359 | 15.6 | 4,250 | 789 | 18.6 |
| 2004 | 6,977 | 1,287 | 18.4 | 2,258 | 370 | 16.4 | 4,719 | 917 | 19.4 |
| 2005 | 6,798 | 1,322 | 19.4 | 2,216 | 355 | 16.0 | 4,582 | 967 | 21.1 |
| 2006 | 7,544 | 1,442 | 19.1 | 2,336 | 361 | 15.5 | 5,208 | 1,081 | 20.8 |
| 2007 | 9,833 | 1,460 | 14.8 | 2,884 | 410 | 14.2 | 6,949 | 1,050 | 15.1 |
| 2008 | 12,305 | 1,496 | 12.2 | 3,071 | 452 | 14.7 | 9,234 | 1,044 | 11.3 |
| 2009 | 15,560 | 1,722 | 11.1 | 3,430 | 457 | 13.3 | 12,130 | 1,265 | 10.4 |
| 2010 | 16,933 | 1,708 | 10.1 | 3,556 | 447 | 12.6 | 13,377 | 1,261 | 9.4 |
| 2011 | 16,958 | 1,682 | 9.9 | 3,777 | 454 | 12.0 | 13,181 | 1,228 | 9.3 |
| 2012 | 17,780 | 1,606 | 9.0 | 4,138 | 456 | 11.0 | 13,642 | 1,150 | 8.4 |
| 2013 | 16,455 | 1,403 | 8.5 | 3,723 | 372 | 10.0 | 12,732 | 1,031 | 8.1 |
| 2014 | 14,392 | 1,326 | 9.2 | 3,468 | 341 | 9.8 | 10,924 | 985 | 9.0 |
| 2015 | 13,315 | 1,395 | 10.5 | 3,423 | 411 | 12.0 | 9,892 | 984 | 9.9 |
| 2016 | 12,223 | 1,356 | 11.1 | 3,357 | 400 | 11.9 | 8,866 | 956 | 10.8 |
| 2017 | 11,980 | 1,379 | 11.5 | 3,425 | 460 | 13.4 | 8,555 | 919 | 10.7 |
| 2018 | 12,140 | 1,587 | 13.1 | 4,121 | 713 | 17.3 | 8,019 | 874 | 10.9 |
| 2019 | 13,301 | 2,045 | 15.4 | 5,365 | 1,192 | 22.2 | 7,936 | 853 | 10.7 |
| 2020 | 10,599 | 1,534 | 14.5 | 4,445 | 874 | 19.7 | 6,154 | 660 | 10.7 |
| 2021 | 9,730 | 1,524 | 15.7 | 4,144 | 842 | 20.3 | 5,586 | 682 | 12.2 |
| 2022 | 10,396 | 1,717 | 16.5 | 3,943 | 915 | 23.2 | 6,453 | 802 | 12.4 |
| 2023 | 8,521 | 1,415 | 16.6 | 3,072 | 787 | 25.6 | 5,449 | 628 | 11.5 |
| 2024 | 3,884 | 571 | 14.7 | 1,465 | 316 | 21.6 | 2,419 | 255 | 10.5 |
| SOURCE: Social Security Administration, Disability Research File, 100 percent data. | |||||||||
| NOTES: Data are current through June 2025. | |||||||||
| Because a number of applications remain pending for more recent years, the allowance rate will change over time. | |||||||||
| Applications with a medical decision may be pending a final nonmedical decision or be subsequently denied for nonmedical reasons. | |||||||||
| From 1999 through 2020, a prototype process in 10 states (representing 20–25 percent of national disability claims) allowed initial denials to be appealed directly to the hearing level without reconsideration. | |||||||||
| Data from 1992 through 1998 are available for disabled workers only. | |||||||||
| SSI = Supplemental Security Income. | |||||||||
| a. Rate determined by dividing medical allowances by all medical decisions for that year. | |||||||||
| b. Rate for the Social Security portion only. | |||||||||
| CONTACT: statistics@ssa.gov. | |||||||||
| Year | All decisions | Decisions on applications for Social Security only | Decisions on applications for both Social Security and SSI | ||||||
|---|---|---|---|---|---|---|---|---|---|
| Total | Allowances | Allowance rate a (percent) | Total | Allowances | Allowance rate a (percent) | Total | Allowances | Allowance rate a,b (percent) | |
| All disabled beneficiaries | |||||||||
| 1999 | 265,058 | 193,198 | 72.9 | 144,847 | 114,207 | 78.8 | 120,211 | 78,991 | 65.7 |
| 2000 | 290,068 | 211,697 | 73.0 | 157,001 | 124,015 | 79.0 | 133,067 | 87,682 | 65.9 |
| 2001 | 313,839 | 228,242 | 72.7 | 164,710 | 130,576 | 79.3 | 149,129 | 97,666 | 65.5 |
| 2002 | 369,875 | 267,597 | 72.3 | 189,671 | 150,834 | 79.5 | 180,204 | 116,763 | 64.8 |
| 2003 | 401,747 | 289,194 | 72.0 | 197,765 | 157,566 | 79.7 | 203,982 | 131,628 | 64.5 |
| 2004 | 415,339 | 301,463 | 72.6 | 196,715 | 159,335 | 81.0 | 218,624 | 142,128 | 65.0 |
| 2005 | 384,341 | 282,797 | 73.6 | 178,312 | 145,587 | 81.6 | 206,029 | 137,210 | 66.6 |
| 2006 | 387,021 | 279,305 | 72.2 | 176,337 | 142,420 | 80.8 | 210,684 | 136,885 | 65.0 |
| 2007 | 387,412 | 274,991 | 71.0 | 169,876 | 136,134 | 80.1 | 217,536 | 138,857 | 63.8 |
| 2008 | 405,203 | 277,034 | 68.4 | 167,464 | 131,704 | 78.6 | 237,739 | 145,330 | 61.1 |
| 2009 | 482,363 | 309,138 | 64.1 | 200,296 | 150,200 | 75.0 | 282,067 | 158,938 | 56.3 |
| 2010 | 537,453 | 320,098 | 59.6 | 230,396 | 162,719 | 70.6 | 307,057 | 157,379 | 51.3 |
| 2011 | 554,186 | 308,178 | 55.6 | 241,140 | 160,277 | 66.5 | 313,046 | 147,901 | 47.2 |
| 2012 | 554,402 | 288,643 | 52.1 | 246,172 | 154,369 | 62.7 | 308,230 | 134,274 | 43.6 |
| 2013 | 538,196 | 267,689 | 49.7 | 250,224 | 148,293 | 59.3 | 287,972 | 119,396 | 41.5 |
| 2014 | 501,597 | 247,805 | 49.4 | 246,940 | 142,329 | 57.6 | 254,657 | 105,476 | 41.4 |
| 2015 | 436,002 | 217,679 | 49.9 | 222,693 | 129,064 | 58.0 | 213,309 | 88,615 | 41.5 |
| 2016 | 399,492 | 199,125 | 49.8 | 207,341 | 119,994 | 57.9 | 192,151 | 79,131 | 41.2 |
| 2017 | 360,013 | 178,771 | 49.7 | 185,768 | 107,733 | 58.0 | 174,245 | 71,038 | 40.8 |
| 2018 | 333,819 | 168,983 | 50.6 | 172,828 | 101,795 | 58.9 | 160,991 | 67,188 | 41.7 |
| 2019 | 310,302 | 161,373 | 52.0 | 159,994 | 96,672 | 60.4 | 150,308 | 64,701 | 43.0 |
| 2020 | 283,772 | 150,418 | 53.0 | 156,892 | 95,164 | 60.7 | 126,880 | 55,254 | 43.5 |
| 2021 | 257,535 | 144,562 | 56.1 | 148,069 | 94,251 | 63.7 | 109,466 | 50,311 | 46.0 |
| 2022 | 208,043 | 120,690 | 58.0 | 119,434 | 78,893 | 66.1 | 88,609 | 41,797 | 47.2 |
| 2023 | 103,164 | 60,367 | 58.5 | 61,630 | 40,781 | 66.2 | 41,534 | 19,586 | 47.2 |
| 2024 | 13,600 | 6,901 | 50.7 | 8,897 | 5,114 | 57.5 | 4,703 | 1,787 | 38.0 |
| Workers | |||||||||
| 1992 | 275,863 | 201,359 | 73.0 | 131,624 | 105,371 | 80.1 | 144,239 | 95,988 | 66.5 |
| 1993 | 310,655 | 217,816 | 70.1 | 143,997 | 112,593 | 78.2 | 166,658 | 105,223 | 63.1 |
| 1994 | 323,607 | 220,645 | 68.2 | 156,458 | 119,338 | 76.3 | 167,149 | 101,307 | 60.6 |
| 1995 | 301,917 | 202,739 | 67.2 | 150,882 | 113,781 | 75.4 | 151,035 | 88,958 | 58.9 |
| 1996 | 306,245 | 204,704 | 66.8 | 157,790 | 116,292 | 73.7 | 148,455 | 88,412 | 59.6 |
| 1997 | 267,288 | 186,278 | 69.7 | 141,021 | 107,539 | 76.3 | 126,267 | 78,739 | 62.4 |
| 1998 | 251,486 | 179,107 | 71.2 | 134,883 | 104,763 | 77.7 | 116,603 | 74,344 | 63.8 |
| 1999 | 260,850 | 190,326 | 73.0 | 141,671 | 111,954 | 79.0 | 119,179 | 78,372 | 65.8 |
| 2000 | 285,620 | 208,668 | 73.1 | 153,649 | 121,651 | 79.2 | 131,971 | 87,017 | 65.9 |
| 2001 | 309,372 | 225,214 | 72.8 | 161,335 | 128,214 | 79.5 | 148,037 | 97,000 | 65.5 |
| 2002 | 364,659 | 264,024 | 72.4 | 185,830 | 148,078 | 79.7 | 178,829 | 115,946 | 64.8 |
| 2003 | 396,352 | 285,621 | 72.1 | 194,232 | 155,060 | 79.8 | 202,120 | 130,561 | 64.6 |
| 2004 | 410,160 | 297,973 | 72.6 | 193,481 | 156,966 | 81.1 | 216,679 | 141,007 | 65.1 |
| 2005 | 379,242 | 279,186 | 73.6 | 175,088 | 143,130 | 81.7 | 204,154 | 136,056 | 66.6 |
| 2006 | 381,766 | 275,741 | 72.2 | 173,088 | 140,092 | 80.9 | 208,678 | 135,649 | 65.0 |
| 2007 | 379,554 | 270,206 | 71.2 | 166,457 | 133,740 | 80.3 | 213,097 | 136,466 | 64.0 |
| 2008 | 393,931 | 270,440 | 68.7 | 163,640 | 128,949 | 78.8 | 230,291 | 141,491 | 61.4 |
| 2009 | 468,958 | 301,999 | 64.4 | 196,271 | 147,402 | 75.1 | 272,687 | 154,597 | 56.7 |
| 2010 | 523,027 | 313,054 | 59.9 | 226,172 | 159,933 | 70.7 | 296,855 | 153,121 | 51.6 |
| 2011 | 539,145 | 300,993 | 55.8 | 236,507 | 157,301 | 66.5 | 302,638 | 143,692 | 47.5 |
| 2012 | 537,777 | 281,216 | 52.3 | 241,101 | 151,289 | 62.7 | 296,676 | 129,927 | 43.8 |
| 2013 | 522,051 | 260,738 | 49.9 | 245,295 | 145,417 | 59.3 | 276,756 | 115,321 | 41.7 |
| 2014 | 487,476 | 241,520 | 49.5 | 242,318 | 139,633 | 57.6 | 245,158 | 101,887 | 41.6 |
| 2015 | 423,453 | 212,030 | 50.1 | 218,496 | 126,603 | 57.9 | 204,957 | 85,427 | 41.7 |
| 2016 | 387,991 | 193,740 | 49.9 | 203,368 | 117,637 | 57.8 | 184,623 | 76,103 | 41.2 |
| 2017 | 349,232 | 173,846 | 49.8 | 182,012 | 105,531 | 58.0 | 167,220 | 68,315 | 40.9 |
| 2018 | 323,508 | 163,994 | 50.7 | 168,940 | 99,466 | 58.9 | 154,568 | 64,528 | 41.7 |
| 2019 | 300,356 | 156,346 | 52.1 | 155,955 | 94,140 | 60.4 | 144,401 | 62,206 | 43.1 |
| 2020 | 275,303 | 145,959 | 53.0 | 153,325 | 92,875 | 60.6 | 121,978 | 53,084 | 43.5 |
| 2021 | 250,315 | 140,513 | 56.1 | 144,872 | 92,096 | 63.6 | 105,443 | 48,417 | 45.9 |
| 2022 | 202,067 | 117,187 | 58.0 | 116,861 | 77,036 | 65.9 | 85,206 | 40,151 | 47.1 |
| 2023 | 100,322 | 58,680 | 58.5 | 60,419 | 39,886 | 66.0 | 39,903 | 18,794 | 47.1 |
| 2024 | 13,235 | 6,681 | 50.5 | 8,704 | 4,970 | 57.1 | 4,531 | 1,711 | 37.8 |
| Widow(er)s | |||||||||
| 1999 | 3,027 | 2,285 | 75.5 | 2,325 | 1,794 | 77.2 | 702 | 491 | 69.9 |
| 2000 | 3,140 | 2,388 | 76.1 | 2,414 | 1,870 | 77.5 | 726 | 518 | 71.3 |
| 2001 | 3,046 | 2,344 | 77.0 | 2,391 | 1,862 | 77.9 | 655 | 482 | 73.6 |
| 2002 | 3,438 | 2,685 | 78.1 | 2,654 | 2,109 | 79.5 | 784 | 576 | 73.5 |
| 2003 | 3,525 | 2,683 | 76.1 | 2,438 | 1,914 | 78.5 | 1,087 | 769 | 70.7 |
| 2004 | 3,241 | 2,589 | 79.9 | 2,199 | 1,804 | 82.0 | 1,042 | 785 | 75.3 |
| 2005 | 3,187 | 2,592 | 81.3 | 2,166 | 1,814 | 83.7 | 1,021 | 778 | 76.2 |
| 2006 | 3,172 | 2,574 | 81.1 | 2,087 | 1,726 | 82.7 | 1,085 | 848 | 78.2 |
| 2007 | 3,642 | 2,877 | 79.0 | 1,960 | 1,601 | 81.7 | 1,682 | 1,276 | 75.9 |
| 2008 | 4,404 | 3,460 | 78.6 | 2,056 | 1,709 | 83.1 | 2,348 | 1,751 | 74.6 |
| 2009 | 4,775 | 3,630 | 76.0 | 2,126 | 1,742 | 81.9 | 2,649 | 1,888 | 71.3 |
| 2010 | 5,178 | 3,695 | 71.4 | 2,193 | 1,703 | 77.7 | 2,985 | 1,992 | 66.7 |
| 2011 | 5,439 | 3,790 | 69.7 | 2,379 | 1,776 | 74.7 | 3,060 | 2,014 | 65.8 |
| 2012 | 5,823 | 3,777 | 64.9 | 2,554 | 1,818 | 71.2 | 3,269 | 1,959 | 59.9 |
| 2013 | 5,958 | 3,669 | 61.6 | 2,559 | 1,748 | 68.3 | 3,399 | 1,921 | 56.5 |
| 2014 | 5,698 | 3,479 | 61.1 | 2,482 | 1,654 | 66.6 | 3,216 | 1,825 | 56.7 |
| 2015 | 4,919 | 3,044 | 61.9 | 2,169 | 1,477 | 68.1 | 2,750 | 1,567 | 57.0 |
| 2016 | 4,553 | 2,901 | 63.7 | 2,007 | 1,387 | 69.1 | 2,546 | 1,514 | 59.5 |
| 2017 | 4,108 | 2,520 | 61.3 | 1,793 | 1,199 | 66.9 | 2,315 | 1,321 | 57.1 |
| 2018 | 3,887 | 2,447 | 63.0 | 1,741 | 1,217 | 69.9 | 2,146 | 1,230 | 57.3 |
| 2019 | 3,769 | 2,468 | 65.5 | 1,843 | 1,295 | 70.3 | 1,926 | 1,173 | 60.9 |
| 2020 | 3,511 | 2,266 | 64.5 | 1,706 | 1,195 | 70.0 | 1,805 | 1,071 | 59.3 |
| 2021 | 2,917 | 1,944 | 66.6 | 1,515 | 1,101 | 72.7 | 1,402 | 843 | 60.1 |
| 2022 | 2,321 | 1,621 | 69.8 | 1,227 | 965 | 78.6 | 1,094 | 656 | 60.0 |
| 2023 | 1,028 | 711 | 69.2 | 539 | 417 | 77.4 | 489 | 294 | 60.1 |
| 2024 | 141 | 104 | 73.8 | 89 | 71 | 79.8 | 52 | 33 | 63.5 |
| Adult children | |||||||||
| 1999 | 1,181 | 587 | 49.7 | 851 | 459 | 53.9 | 330 | 128 | 38.8 |
| 2000 | 1,308 | 641 | 49.0 | 938 | 494 | 52.7 | 370 | 147 | 39.7 |
| 2001 | 1,421 | 684 | 48.1 | 984 | 500 | 50.8 | 437 | 184 | 42.1 |
| 2002 | 1,778 | 888 | 49.9 | 1,187 | 647 | 54.5 | 591 | 241 | 40.8 |
| 2003 | 1,870 | 890 | 47.6 | 1,095 | 592 | 54.1 | 775 | 298 | 38.5 |
| 2004 | 1,938 | 901 | 46.5 | 1,035 | 565 | 54.6 | 903 | 336 | 37.2 |
| 2005 | 1,912 | 1,019 | 53.3 | 1,058 | 643 | 60.8 | 854 | 376 | 44.0 |
| 2006 | 2,083 | 990 | 47.5 | 1,162 | 602 | 51.8 | 921 | 388 | 42.1 |
| 2007 | 4,216 | 1,908 | 45.3 | 1,459 | 793 | 54.4 | 2,757 | 1,115 | 40.4 |
| 2008 | 6,868 | 3,134 | 45.6 | 1,768 | 1,046 | 59.2 | 5,100 | 2,088 | 40.9 |
| 2009 | 8,630 | 3,509 | 40.7 | 1,899 | 1,056 | 55.6 | 6,731 | 2,453 | 36.4 |
| 2010 | 9,248 | 3,349 | 36.2 | 2,031 | 1,083 | 53.3 | 7,217 | 2,266 | 31.4 |
| 2011 | 9,602 | 3,395 | 35.4 | 2,254 | 1,200 | 53.2 | 7,348 | 2,195 | 29.9 |
| 2012 | 10,802 | 3,650 | 33.8 | 2,517 | 1,262 | 50.1 | 8,285 | 2,388 | 28.8 |
| 2013 | 10,187 | 3,282 | 32.2 | 2,370 | 1,128 | 47.6 | 7,817 | 2,154 | 27.6 |
| 2014 | 8,423 | 2,806 | 33.3 | 2,140 | 1,042 | 48.7 | 6,283 | 1,764 | 28.1 |
| 2015 | 7,630 | 2,605 | 34.1 | 2,028 | 984 | 48.5 | 5,602 | 1,621 | 28.9 |
| 2016 | 6,948 | 2,484 | 35.8 | 1,966 | 970 | 49.3 | 4,982 | 1,514 | 30.4 |
| 2017 | 6,673 | 2,405 | 36.0 | 1,963 | 1,003 | 51.1 | 4,710 | 1,402 | 29.8 |
| 2018 | 6,424 | 2,542 | 39.6 | 2,147 | 1,112 | 51.8 | 4,277 | 1,430 | 33.4 |
| 2019 | 6,177 | 2,559 | 41.4 | 2,196 | 1,237 | 56.3 | 3,981 | 1,322 | 33.2 |
| 2020 | 4,958 | 2,193 | 44.2 | 1,861 | 1,094 | 58.8 | 3,097 | 1,099 | 35.5 |
| 2021 | 4,303 | 2,105 | 48.9 | 1,682 | 1,054 | 62.7 | 2,621 | 1,051 | 40.1 |
| 2022 | 3,655 | 1,882 | 51.5 | 1,346 | 892 | 66.3 | 2,309 | 990 | 42.9 |
| 2023 | 1,814 | 976 | 53.8 | 672 | 478 | 71.1 | 1,142 | 498 | 43.6 |
| 2024 | 224 | 116 | 51.8 | 104 | 73 | 70.2 | 120 | 43 | 35.8 |
| SOURCE: Social Security Administration, Disability Research File, 100 percent data. | |||||||||
| NOTES: Data are current through July 2025. | |||||||||
| Because a number of applications remain pending for more recent years, the allowance rate will change over time. | |||||||||
| Applications with a medical decision may be pending a final nonmedical decision or be subsequently denied for nonmedical reasons. | |||||||||
| From 1999 through 2020, a prototype process in 10 states (representing 20–25 percent of national disability claims) allowed initial denials to be appealed directly to the hearing level without reconsideration. | |||||||||
| Data from 1992 through 1998 are available for disabled workers only. | |||||||||
| SSI = Supplemental Security Income. | |||||||||
| a. Rate determined by dividing medical allowances by all medical decisions for that year. | |||||||||
| b. Rate for the Social Security portion only. | |||||||||
| CONTACT: statistics@ssa.gov. | |||||||||
| Year | Total | Meets level of severity of listings | Equals level of severity of listings | Medical and vocational factors considered | Other a | |
|---|---|---|---|---|---|---|
| Number | Percent | |||||
| All disabled beneficiaries | ||||||
| 1999 | 708,797 | 100.0 | 33.0 | 5.9 | 26.9 | 34.2 |
| 2000 | 766,047 | 100.0 | 31.1 | 6.2 | 29.2 | 33.5 |
| 2001 | 840,542 | 100.0 | 30.0 | 6.1 | 30.1 | 33.9 |
| 2002 | 898,047 | 100.0 | 28.5 | 5.3 | 30.1 | 36.1 |
| 2003 | 928,747 | 100.0 | 27.1 | 5.1 | 31.1 | 36.7 |
| 2004 | 961,376 | 100.0 | 26.4 | 4.9 | 31.5 | 37.2 |
| 2005 | 907,877 | 100.0 | 26.5 | 4.7 | 32.0 | 36.8 |
| 2006 | 890,752 | 100.0 | 26.4 | 4.5 | 31.9 | 37.3 |
| 2007 | 913,269 | 100.0 | 26.1 | 4.6 | 32.7 | 36.6 |
| 2008 | 969,935 | 100.0 | 25.5 | 5.2 | 34.1 | 35.2 |
| 2009 | 1,105,781 | 100.0 | 24.3 | 5.2 | 35.7 | 34.8 |
| 2010 | 1,120,313 | 100.0 | 23.1 | 5.1 | 36.2 | 35.6 |
| 2011 | 1,074,600 | 100.0 | 22.4 | 5.0 | 37.5 | 35.0 |
| 2012 | 1,038,076 | 100.0 | 22.1 | 5.0 | 38.1 | 34.8 |
| 2013 | 965,434 | 100.0 | 22.4 | 4.7 | 37.1 | 35.8 |
| 2014 | 917,751 | 100.0 | 23.1 | 4.6 | 36.7 | 35.7 |
| 2015 | 853,073 | 100.0 | 24.3 | 4.4 | 36.0 | 35.2 |
| 2016 | 807,101 | 100.0 | 26.0 | 4.4 | 35.3 | 34.3 |
| 2017 | 764,311 | 100.0 | 27.5 | 4.4 | 34.5 | 33.6 |
| 2018 | 741,414 | 100.0 | 29.4 | 4.4 | 34.4 | 31.7 |
| 2019 | 735,710 | 100.0 | 33.1 | 4.4 | 37.4 | 25.1 |
| 2020 | 670,200 | 100.0 | 32.2 | 4.1 | 37.5 | 26.1 |
| 2021 | 663,421 | 100.0 | 32.0 | 3.6 | 37.6 | 26.9 |
| 2022 | 630,193 | 100.0 | 33.6 | 3.4 | 38.4 | 24.6 |
| 2023 | 566,389 | 100.0 | 36.7 | 3.2 | 41.5 | 18.7 |
| 2024 | 438,079 | 100.0 | 38.9 | 2.8 | 42.0 | 16.3 |
| Workers | ||||||
| 1992 | 689,111 | 100.0 | 34.3 | 11.1 | 24.3 | 30.3 |
| 1993 | 695,007 | 100.0 | 34.3 | 8.7 | 23.6 | 33.4 |
| 1994 | 671,791 | 100.0 | 34.5 | 6.9 | 25.6 | 32.9 |
| 1995 | 628,380 | 100.0 | 34.5 | 6.7 | 26.8 | 31.9 |
| 1996 | 652,221 | 100.0 | 34.2 | 7.0 | 27.4 | 31.5 |
| 1997 | 602,277 | 100.0 | 35.0 | 7.5 | 26.4 | 31.1 |
| 1998 | 613,181 | 100.0 | 35.5 | 6.6 | 26.9 | 31.0 |
| 1999 | 640,065 | 100.0 | 33.6 | 6.3 | 28.3 | 31.9 |
| 2000 | 695,007 | 100.0 | 31.7 | 6.5 | 30.6 | 31.2 |
| 2001 | 769,877 | 100.0 | 30.5 | 6.4 | 31.3 | 31.8 |
| 2002 | 823,981 | 100.0 | 29.0 | 5.6 | 31.4 | 34.0 |
| 2003 | 853,832 | 100.0 | 27.5 | 5.3 | 32.5 | 34.8 |
| 2004 | 883,784 | 100.0 | 26.7 | 5.2 | 32.9 | 35.2 |
| 2005 | 829,087 | 100.0 | 27.0 | 4.9 | 33.6 | 34.5 |
| 2006 | 811,818 | 100.0 | 26.9 | 4.7 | 33.5 | 34.9 |
| 2007 | 828,834 | 100.0 | 26.5 | 4.9 | 34.6 | 34.0 |
| 2008 | 878,274 | 100.0 | 26.0 | 5.5 | 36.2 | 32.3 |
| 2009 | 1,006,200 | 100.0 | 24.8 | 5.5 | 37.8 | 31.9 |
| 2010 | 1,016,551 | 100.0 | 23.6 | 5.4 | 38.5 | 32.5 |
| 2011 | 971,651 | 100.0 | 22.9 | 5.3 | 40.1 | 31.7 |
| 2012 | 931,342 | 100.0 | 22.7 | 5.3 | 41.0 | 31.0 |
| 2013 | 862,286 | 100.0 | 23.2 | 5.1 | 40.1 | 31.7 |
| 2014 | 816,572 | 100.0 | 24.0 | 4.9 | 39.8 | 31.3 |
| 2015 | 748,126 | 100.0 | 25.5 | 4.8 | 39.6 | 30.0 |
| 2016 | 707,557 | 100.0 | 27.3 | 4.8 | 38.8 | 29.1 |
| 2017 | 664,862 | 100.0 | 28.9 | 4.8 | 38.1 | 28.2 |
| 2018 | 639,370 | 100.0 | 29.9 | 4.8 | 38.1 | 27.2 |
| 2019 | 643,857 | 100.0 | 30.8 | 4.6 | 39.6 | 25.0 |
| 2020 | 591,841 | 100.0 | 30.3 | 4.2 | 39.7 | 25.8 |
| 2021 | 587,441 | 100.0 | 30.5 | 3.7 | 40.3 | 25.5 |
| 2022 | 551,417 | 100.0 | 32.3 | 3.5 | 41.7 | 22.4 |
| 2023 | 484,159 | 100.0 | 36.0 | 3.4 | 46.3 | 14.3 |
| 2024 | 357,754 | 100.0 | 42.0 | 3.2 | 49.7 | 5.2 |
| Widow(er)s | ||||||
| 1999 | 29,108 | 100.0 | 14.9 | 2.5 | 24.6 | 58.0 |
| 2000 | 29,679 | 100.0 | 12.8 | 2.5 | 26.3 | 58.4 |
| 2001 | 30,113 | 100.0 | 12.3 | 2.6 | 27.0 | 58.1 |
| 2002 | 30,547 | 100.0 | 11.4 | 2.1 | 26.5 | 60.0 |
| 2003 | 29,977 | 100.0 | 10.8 | 2.2 | 26.1 | 60.9 |
| 2004 | 30,780 | 100.0 | 10.1 | 1.9 | 26.0 | 62.0 |
| 2005 | 30,215 | 100.0 | 9.7 | 1.7 | 25.5 | 63.1 |
| 2006 | 29,443 | 100.0 | 9.6 | 1.5 | 24.2 | 64.7 |
| 2007 | 29,540 | 100.0 | 9.1 | 1.6 | 24.3 | 64.9 |
| 2008 | 31,137 | 100.0 | 8.7 | 1.7 | 24.8 | 64.7 |
| 2009 | 32,502 | 100.0 | 8.1 | 1.9 | 26.0 | 63.9 |
| 2010 | 34,228 | 100.0 | 7.7 | 1.9 | 25.3 | 65.1 |
| 2011 | 33,589 | 100.0 | 7.8 | 1.7 | 25.3 | 65.3 |
| 2012 | 35,317 | 100.0 | 6.8 | 1.6 | 24.2 | 67.4 |
| 2013 | 34,193 | 100.0 | 6.2 | 1.6 | 23.0 | 69.2 |
| 2014 | 33,451 | 100.0 | 6.3 | 1.5 | 21.7 | 70.6 |
| 2015 | 32,174 | 100.0 | 6.6 | 1.3 | 21.2 | 70.9 |
| 2016 | 30,417 | 100.0 | 6.5 | 1.2 | 20.4 | 71.9 |
| 2017 | 29,042 | 100.0 | 7.0 | 1.2 | 20.2 | 71.6 |
| 2018 | 27,316 | 100.0 | 8.4 | 1.4 | 23.9 | 66.3 |
| 2019 | 25,044 | 100.0 | 16.0 | 2.8 | 49.7 | 31.4 |
| 2020 | 22,758 | 100.0 | 14.6 | 2.4 | 46.1 | 36.9 |
| 2021 | 21,977 | 100.0 | 13.3 | 1.6 | 37.5 | 47.6 |
| 2022 | 19,878 | 100.0 | 12.7 | 1.6 | 38.8 | 46.9 |
| 2023 | 16,785 | 100.0 | 12.4 | 1.4 | 39.2 | 46.9 |
| 2024 | 13,451 | 100.0 | 9.2 | 0.7 | 28.8 | 61.3 |
| Adult children | ||||||
| 1999 | 39,624 | 100.0 | 35.9 | 3.2 | 7.4 | 53.5 |
| 2000 | 41,361 | 100.0 | 35.0 | 3.1 | 7.3 | 54.7 |
| 2001 | 40,552 | 100.0 | 33.0 | 3.0 | 8.0 | 56.0 |
| 2002 | 43,519 | 100.0 | 31.7 | 2.9 | 7.6 | 57.8 |
| 2003 | 44,938 | 100.0 | 31.0 | 2.7 | 8.2 | 58.2 |
| 2004 | 46,812 | 100.0 | 30.1 | 2.7 | 8.5 | 58.6 |
| 2005 | 48,575 | 100.0 | 28.5 | 2.5 | 8.3 | 60.7 |
| 2006 | 49,491 | 100.0 | 28.4 | 2.6 | 8.8 | 60.2 |
| 2007 | 54,895 | 100.0 | 28.3 | 2.6 | 9.0 | 60.1 |
| 2008 | 60,524 | 100.0 | 26.6 | 2.5 | 8.6 | 62.3 |
| 2009 | 67,079 | 100.0 | 24.8 | 2.5 | 8.8 | 63.9 |
| 2010 | 69,534 | 100.0 | 23.2 | 2.3 | 8.3 | 66.1 |
| 2011 | 69,360 | 100.0 | 21.9 | 2.3 | 7.9 | 67.9 |
| 2012 | 71,417 | 100.0 | 21.4 | 2.2 | 7.3 | 69.0 |
| 2013 | 68,955 | 100.0 | 21.0 | 2.0 | 7.0 | 70.0 |
| 2014 | 67,728 | 100.0 | 20.7 | 1.9 | 6.6 | 70.9 |
| 2015 | 72,773 | 100.0 | 19.7 | 1.7 | 5.9 | 72.7 |
| 2016 | 69,127 | 100.0 | 21.7 | 1.7 | 5.7 | 71.0 |
| 2017 | 70,407 | 100.0 | 23.0 | 1.8 | 5.5 | 69.7 |
| 2018 | 74,728 | 100.0 | 33.2 | 2.3 | 6.6 | 58.0 |
| 2019 | 66,809 | 100.0 | 61.3 | 3.9 | 12.0 | 22.9 |
| 2020 | 55,601 | 100.0 | 60.4 | 3.7 | 10.4 | 25.6 |
| 2021 | 54,003 | 100.0 | 55.5 | 2.9 | 7.9 | 33.7 |
| 2022 | 58,898 | 100.0 | 52.7 | 2.5 | 6.8 | 38.0 |
| 2023 | 65,445 | 100.0 | 48.0 | 2.0 | 5.9 | 44.1 |
| 2024 | 66,874 | 100.0 | 28.5 | 1.0 | 3.6 | 67.0 |
| SOURCE: Social Security Administration, Disability Research File, 100 percent data. | ||||||
| NOTES: Data are current through June 2025 for the initial and reconsideration levels and through July 2025 for the hearing level or above. | ||||||
| Because a number of applications remain pending for more recent years, the numbers and percentages will change over time. | ||||||
| Applications with a medical decision may be pending a final nonmedical decision or be subsequently denied for nonmedical reasons. | ||||||
| Data include decisions for Social Security–only applications and applications for both Social Security and Supplemental Security Income (SSI); they do not include SSI-only applications. | ||||||
| Data from 1992 through 1998 are available for disabled workers only. | ||||||
| a. Includes applications for which the disability was previously established and those for which the basis for the determination is not available. The majority of applications for which the basis of determination is not available are cases allowed at or above the hearing level. | ||||||
| CONTACT: statistics@ssa.gov. | ||||||
| Year | Total | Impairment did not or is not expected to last 12 months | Impairment is not severe | Able to do usual past work | Able to do other type of work | Other a | |
|---|---|---|---|---|---|---|---|
| Number | Percent | ||||||
| All disabled beneficiaries | |||||||
| 1999 | 450,051 | 100.0 | 10.2 | 17.8 | 28.3 | 30.8 | 12.9 |
| 2000 | 460,284 | 100.0 | 10.0 | 17.2 | 28.2 | 30.4 | 14.1 |
| 2001 | 500,414 | 100.0 | 9.2 | 16.7 | 28.0 | 31.1 | 14.9 |
| 2002 | 584,497 | 100.0 | 8.5 | 17.1 | 28.2 | 31.3 | 14.9 |
| 2003 | 636,769 | 100.0 | 7.5 | 17.7 | 28.2 | 31.8 | 14.9 |
| 2004 | 683,445 | 100.0 | 6.8 | 18.4 | 27.6 | 31.5 | 15.7 |
| 2005 | 649,134 | 100.0 | 6.5 | 19.2 | 26.7 | 31.4 | 16.3 |
| 2006 | 660,526 | 100.0 | 6.3 | 19.8 | 26.2 | 31.3 | 16.4 |
| 2007 | 649,725 | 100.0 | 6.3 | 20.4 | 26.3 | 30.9 | 16.0 |
| 2008 | 669,785 | 100.0 | 5.8 | 21.4 | 26.0 | 31.3 | 15.5 |
| 2009 | 800,192 | 100.0 | 4.6 | 22.5 | 25.4 | 32.3 | 15.1 |
| 2010 | 880,600 | 100.0 | 4.1 | 23.3 | 24.7 | 32.3 | 15.5 |
| 2011 | 893,521 | 100.0 | 3.9 | 23.8 | 20.4 | 33.6 | 18.3 |
| 2012 | 891,123 | 100.0 | 3.8 | 24.7 | 16.2 | 39.0 | 16.3 |
| 2013 | 851,974 | 100.0 | 4.0 | 24.9 | 15.1 | 42.4 | 13.5 |
| 2014 | 830,534 | 100.0 | 3.9 | 24.7 | 13.8 | 42.7 | 14.8 |
| 2015 | 788,079 | 100.0 | 4.1 | 24.3 | 11.7 | 43.1 | 16.8 |
| 2016 | 745,399 | 100.0 | 4.2 | 23.7 | 10.2 | 43.7 | 18.3 |
| 2017 | 705,907 | 100.0 | 4.2 | 23.9 | 9.1 | 43.8 | 19.0 |
| 2018 | 669,214 | 100.0 | 3.9 | 24.8 | 8.6 | 42.7 | 20.0 |
| 2019 | 668,427 | 100.0 | 3.6 | 24.5 | 8.2 | 43.7 | 20.0 |
| 2020 | 621,319 | 100.0 | 3.2 | 22.4 | 8.0 | 42.7 | 23.6 |
| 2021 | 596,584 | 100.0 | 2.3 | 20.9 | 7.4 | 39.7 | 29.7 |
| 2022 | 579,699 | 100.0 | 1.5 | 21.4 | 6.6 | 35.8 | 34.6 |
| 2023 | 539,436 | 100.0 | 1.2 | 21.3 | 5.4 | 34.1 | 38.0 |
| 2024 | 466,720 | 100.0 | 1.5 | 20.0 | 5.2 | 35.4 | 37.9 |
| Workers | |||||||
| 1992 | 487,164 | 100.0 | 10.7 | 22.9 | 28.4 | 29.6 | 8.4 |
| 1993 | 546,532 | 100.0 | 10.4 | 22.7 | 27.6 | 29.8 | 9.5 |
| 1994 | 578,664 | 100.0 | 10.2 | 21.5 | 25.9 | 28.8 | 13.6 |
| 1995 | 547,145 | 100.0 | 10.6 | 20.8 | 25.4 | 29.4 | 13.8 |
| 1996 | 542,493 | 100.0 | 10.2 | 19.6 | 24.7 | 30.6 | 14.8 |
| 1997 | 453,676 | 100.0 | 10.6 | 18.5 | 25.7 | 30.5 | 14.6 |
| 1998 | 426,158 | 100.0 | 10.8 | 18.3 | 27.8 | 30.8 | 12.3 |
| 1999 | 423,494 | 100.0 | 10.6 | 17.4 | 29.3 | 30.1 | 12.6 |
| 2000 | 434,363 | 100.0 | 10.4 | 16.8 | 29.3 | 29.7 | 13.9 |
| 2001 | 474,536 | 100.0 | 9.5 | 16.4 | 29.0 | 30.4 | 14.7 |
| 2002 | 554,996 | 100.0 | 8.8 | 16.8 | 29.2 | 30.6 | 14.7 |
| 2003 | 603,986 | 100.0 | 7.7 | 17.4 | 29.2 | 31.0 | 14.6 |
| 2004 | 648,622 | 100.0 | 7.0 | 18.2 | 28.5 | 30.8 | 15.4 |
| 2005 | 614,442 | 100.0 | 6.7 | 19.0 | 27.7 | 30.6 | 16.0 |
| 2006 | 620,571 | 100.0 | 6.5 | 19.5 | 27.4 | 30.6 | 16.0 |
| 2007 | 606,800 | 100.0 | 6.6 | 20.1 | 27.7 | 30.0 | 15.6 |
| 2008 | 625,607 | 100.0 | 6.1 | 21.1 | 27.4 | 30.3 | 15.1 |
| 2009 | 747,850 | 100.0 | 4.9 | 22.3 | 26.8 | 31.2 | 14.7 |
| 2010 | 822,772 | 100.0 | 4.3 | 23.2 | 26.1 | 31.2 | 15.2 |
| 2011 | 836,265 | 100.0 | 4.1 | 23.6 | 21.4 | 32.6 | 18.2 |
| 2012 | 833,666 | 100.0 | 4.0 | 24.5 | 17.0 | 38.4 | 16.1 |
| 2013 | 797,677 | 100.0 | 4.2 | 24.7 | 15.9 | 42.0 | 13.2 |
| 2014 | 780,244 | 100.0 | 4.1 | 24.5 | 14.4 | 42.4 | 14.6 |
| 2015 | 740,525 | 100.0 | 4.3 | 24.0 | 12.2 | 42.9 | 16.6 |
| 2016 | 701,526 | 100.0 | 4.4 | 23.4 | 10.6 | 43.5 | 18.1 |
| 2017 | 663,346 | 100.0 | 4.4 | 23.5 | 9.5 | 43.7 | 18.9 |
| 2018 | 625,348 | 100.0 | 4.1 | 24.2 | 9.0 | 42.8 | 19.9 |
| 2019 | 618,441 | 100.0 | 3.8 | 23.6 | 8.6 | 44.0 | 19.9 |
| 2020 | 577,948 | 100.0 | 3.4 | 21.5 | 8.4 | 43.1 | 23.6 |
| 2021 | 556,876 | 100.0 | 2.4 | 19.9 | 7.8 | 40.0 | 29.9 |
| 2022 | 541,153 | 100.0 | 1.6 | 20.4 | 6.9 | 36.0 | 35.1 |
| 2023 | 502,031 | 100.0 | 1.3 | 20.1 | 5.7 | 34.2 | 38.7 |
| 2024 | 437,081 | 100.0 | 1.6 | 18.9 | 5.5 | 35.5 | 38.6 |
| Widow(er)s | |||||||
| 1999 | 9,735 | 100.0 | 5.6 | 29.0 | 31.8 | 22.7 | 10.8 |
| 2000 | 9,024 | 100.0 | 5.3 | 29.0 | 31.4 | 22.3 | 12.1 |
| 2001 | 8,751 | 100.0 | 4.7 | 27.6 | 31.2 | 22.8 | 13.7 |
| 2002 | 8,959 | 100.0 | 4.8 | 25.5 | 32.9 | 23.9 | 13.0 |
| 2003 | 9,577 | 100.0 | 4.2 | 25.7 | 33.1 | 23.7 | 13.3 |
| 2004 | 9,576 | 100.0 | 3.6 | 26.5 | 32.2 | 23.0 | 14.7 |
| 2005 | 9,279 | 100.0 | 3.6 | 26.7 | 32.0 | 22.8 | 15.0 |
| 2006 | 9,812 | 100.0 | 3.8 | 25.7 | 31.6 | 23.1 | 15.9 |
| 2007 | 9,003 | 100.0 | 3.6 | 27.3 | 31.3 | 21.9 | 15.9 |
| 2008 | 8,653 | 100.0 | 3.3 | 27.8 | 30.8 | 21.9 | 16.2 |
| 2009 | 8,986 | 100.0 | 2.8 | 28.8 | 30.2 | 22.2 | 16.0 |
| 2010 | 9,789 | 100.0 | 2.7 | 29.3 | 27.9 | 24.0 | 16.0 |
| 2011 | 9,909 | 100.0 | 2.9 | 28.1 | 26.9 | 24.9 | 17.2 |
| 2012 | 10,143 | 100.0 | 2.3 | 28.8 | 23.4 | 28.4 | 17.0 |
| 2013 | 10,251 | 100.0 | 2.4 | 28.6 | 22.2 | 32.6 | 14.3 |
| 2014 | 9,949 | 100.0 | 2.3 | 27.5 | 21.4 | 33.1 | 15.6 |
| 2015 | 9,170 | 100.0 | 2.3 | 26.2 | 20.6 | 33.6 | 17.3 |
| 2016 | 8,485 | 100.0 | 2.3 | 26.1 | 17.3 | 35.1 | 19.2 |
| 2017 | 8,088 | 100.0 | 2.1 | 25.9 | 17.5 | 34.1 | 20.5 |
| 2018 | 8,124 | 100.0 | 2.1 | 26.8 | 15.0 | 33.9 | 22.2 |
| 2019 | 9,854 | 100.0 | 1.5 | 28.4 | 13.8 | 33.4 | 22.8 |
| 2020 | 9,371 | 100.0 | 1.5 | 24.6 | 13.5 | 33.0 | 27.4 |
| 2021 | 9,147 | 100.0 | 1.0 | 23.2 | 12.3 | 31.2 | 32.3 |
| 2022 | 8,305 | 100.0 | 0.7 | 23.7 | 10.2 | 27.4 | 38.1 |
| 2023 | 6,648 | 100.0 | 0.4 | 23.6 | 8.0 | 25.9 | 42.1 |
| 2024 | 4,548 | 100.0 | 0.9 | 22.1 | 6.6 | 26.0 | 44.4 |
| Adult children | |||||||
| 1999 | 16,822 | 100.0 | 3.1 | 22.7 | 0.7 | 53.3 | 20.2 |
| 2000 | 16,897 | 100.0 | 2.8 | 22.9 | 0.7 | 51.9 | 21.7 |
| 2001 | 17,127 | 100.0 | 2.5 | 21.3 | 0.9 | 52.9 | 22.3 |
| 2002 | 20,542 | 100.0 | 2.3 | 21.6 | 0.8 | 53.6 | 21.7 |
| 2003 | 23,206 | 100.0 | 2.0 | 21.8 | 0.7 | 53.6 | 21.9 |
| 2004 | 25,247 | 100.0 | 1.9 | 22.1 | 0.5 | 52.4 | 23.1 |
| 2005 | 25,413 | 100.0 | 1.8 | 21.3 | 0.4 | 52.8 | 23.8 |
| 2006 | 30,143 | 100.0 | 1.7 | 23.6 | 0.4 | 50.3 | 23.9 |
| 2007 | 33,922 | 100.0 | 1.6 | 24.0 | 0.3 | 49.9 | 24.2 |
| 2008 | 35,525 | 100.0 | 1.5 | 24.8 | 0.2 | 51.0 | 22.5 |
| 2009 | 43,356 | 100.0 | 1.2 | 23.4 | 0.1 | 53.5 | 21.8 |
| 2010 | 48,039 | 100.0 | 1.2 | 24.7 | 0.1 | 53.1 | 20.9 |
| 2011 | 47,347 | 100.0 | 1.0 | 26.2 | (L) | 52.6 | 20.1 |
| 2012 | 47,314 | 100.0 | 0.9 | 27.7 | (L) | 51.9 | 19.4 |
| 2013 | 44,046 | 100.0 | 0.9 | 28.1 | (L) | 52.2 | 18.8 |
| 2014 | 40,341 | 100.0 | 0.9 | 29.4 | 0.0 | 50.5 | 19.1 |
| 2015 | 38,384 | 100.0 | 0.8 | 30.0 | (L) | 49.5 | 19.7 |
| 2016 | 35,388 | 100.0 | 0.8 | 29.4 | (L) | 49.1 | 20.7 |
| 2017 | 34,473 | 100.0 | 0.8 | 31.2 | (L) | 47.6 | 20.4 |
| 2018 | 35,742 | 100.0 | 0.6 | 35.4 | (L) | 43.0 | 21.0 |
| 2019 | 40,132 | 100.0 | 0.5 | 37.6 | 0.0 | 41.5 | 20.4 |
| 2020 | 34,000 | 100.0 | 0.5 | 36.8 | 0.0 | 39.9 | 22.8 |
| 2021 | 30,561 | 100.0 | 0.4 | 37.3 | 0.0 | 37.4 | 24.9 |
| 2022 | 30,241 | 100.0 | 0.2 | 39.9 | 0.0 | 34.7 | 25.2 |
| 2023 | 30,757 | 100.0 | 0.1 | 39.7 | 0.0 | 34.6 | 25.6 |
| 2024 | 25,091 | 100.0 | 0.2 | 40.2 | 0.0 | 35.0 | 24.7 |
| SOURCE: Social Security Administration, Disability Research File, 100 percent data. | |||||||
| NOTES: Data are current through June 2025 for the initial and reconsideration levels and through July 2025 for the hearing level or above. | |||||||
| Because a number of applications remain pending for more recent years, the numbers and percentages will change over time. | |||||||
| Applications with a medical decision may be pending a final nonmedical decision or be subsequently denied for nonmedical reasons. | |||||||
| Data include decisions for Social Security–only applications and applications for both Social Security and Supplemental Security Income (SSI); they do not include SSI-only applications. | |||||||
| Data from 1992 through 1998 are available for disabled workers only. | |||||||
| (L) = less than 0.05 percent. | |||||||
| a. Applicant has an impairment resulting from drug addiction or alcoholism, provided insufficient medical evidence, failed to cooperate, failed to follow prescribed treatment, did not want to continue development of the claim, or returned to substantial work before disability could be established. Also includes cases denied at or above the hearing level for which the basis of determination is not available. | |||||||
| CONTACT: statistics@ssa.gov. | |||||||