Annual Statistical Report on the Social Security Disability Insurance Program, 2025
Disabled Beneficiaries Receiving Social Security, SSI, or Both
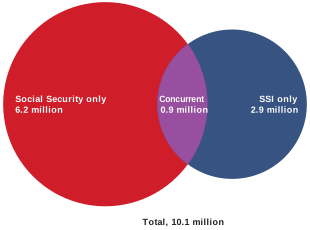
Chart 12. Social Security and SSI beneficiaries aged 18–64 receiving benefits on the basis of disability, December 2025
In December 2025, about 10.1 million people aged 18–64 received benefits on the basis of disability. Sixty-two percent (6.2 million) received benefits from the Social Security program only, 29 percent (2.9 million) received benefits from the Supplemental Security Income (SSI) program only, and 9 percent (0.9 million) received benefits from both programs concurrently.
SOURCE: Table 66.
| Year | Total | Social Security only | SSI only | Both Social Security and SSI | ||||||
|---|---|---|---|---|---|---|---|---|---|---|
| Total | Workers | Widow(er)s | Adult children | Total | Workers | Widow(er)s | Adult children | |||
| Number | ||||||||||
| 1996 | 7,689,664 | 4,122,152 | -- | -- | -- | 2,559,750 | 1,007,762 | -- | -- | -- |
| 1997 | 7,811,748 | 4,250,155 | -- | -- | -- | 2,550,105 | 1,011,488 | -- | -- | -- |
| 1998 | 8,086,259 | 4,440,264 | -- | -- | -- | 2,618,615 | 1,027,380 | -- | -- | -- |
| 1999 | 8,399,309 | 4,703,774 | -- | -- | -- | 2,650,586 | 1,044,949 | -- | -- | -- |
| 2000 | 8,599,465 | 4,850,835 | -- | -- | -- | 2,690,446 | 1,058,184 | -- | -- | -- |
| 2001 | 8,791,338 | 4,979,844 | 4,495,477 | 87,833 | 396,534 | 2,732,020 | 1,079,474 | 772,562 | 35,222 | 271,690 |
| 2002 | 9,106,014 | 5,228,262 | 4,738,246 | 87,900 | 402,116 | 2,768,782 | 1,108,970 | 801,351 | 34,671 | 272,948 |
| 2003 | 9,445,573 | 5,492,325 | 4,997,137 | 87,203 | 407,985 | 2,811,647 | 1,141,601 | 833,269 | 34,101 | 274,231 |
| 2004 | 9,773,201 | 5,756,093 | 5,257,314 | 89,874 | 408,905 | 2,850,815 | 1,166,293 | 858,850 | 33,072 | 274,371 |
| 2005 | 10,081,625 | 5,998,755 | 5,491,980 | 86,422 | 420,353 | 2,880,931 | 1,201,939 | 893,437 | 32,302 | 276,200 |
| 2006 | 10,362,419 | 6,210,289 | 5,698,494 | 85,259 | 426,536 | 2,928,034 | 1,224,096 | 915,832 | 31,443 | 276,821 |
| 2007 | 10,627,905 | 6,405,985 | 5,888,133 | 83,481 | 434,371 | 2,966,648 | 1,255,272 | 942,011 | 30,876 | 282,385 |
| 2008 | 10,974,914 | 6,641,818 | 6,115,214 | 82,100 | 444,504 | 3,040,764 | 1,292,332 | 971,455 | 30,608 | 290,269 |
| 2009 | 11,451,980 | 7,000,692 | 6,462,635 | 82,167 | 455,890 | 3,138,143 | 1,313,145 | 989,094 | 29,991 | 294,060 |
| 2010 | 11,988,072 | 7,356,565 | 6,810,060 | 82,369 | 464,136 | 3,262,055 | 1,369,452 | 1,035,969 | 30,216 | 303,267 |
| 2011 | 12,373,698 | 7,596,688 | 7,092,419 | 81,922 | 422,347 | 3,395,233 | 1,381,777 | 1,060,694 | 30,173 | 290,910 |
| 2012 | 12,734,301 | 7,864,664 | 7,292,752 | 82,181 | 489,731 | 3,459,188 | 1,410,449 | 1,060,201 | 30,280 | 319,968 |
| 2013 | 12,956,156 | 8,021,728 | 7,435,292 | 82,173 | 504,263 | 3,527,788 | 1,406,640 | 1,050,469 | 30,222 | 325,949 |
| 2014 | 12,982,160 | 8,068,997 | 7,468,094 | 81,284 | 519,619 | 3,540,152 | 1,373,011 | 1,019,599 | 29,914 | 323,498 |
| 2015 | 12,951,414 | 8,062,731 | 7,451,425 | 80,910 | 530,396 | 3,545,422 | 1,343,261 | 985,913 | 29,974 | 327,374 |
| 2016 | 12,827,804 | 7,981,949 | 7,362,028 | 79,702 | 540,219 | 3,535,396 | 1,310,459 | 951,118 | 29,784 | 329,557 |
| 2017 | 12,688,504 | 7,883,266 | 7,254,741 | 78,749 | 549,776 | 3,511,636 | 1,293,602 | 929,103 | 29,718 | 334,781 |
| 2018 | 12,481,819 | 7,767,476 | 7,128,499 | 77,269 | 561,708 | 3,461,818 | 1,252,525 | 883,650 | 28,842 | 340,033 |
| 2019 | 12,292,267 | 7,645,606 | 6,999,238 | 75,134 | 571,234 | 3,446,335 | 1,200,326 | 832,779 | 27,564 | 339,983 |
| 2020 | 12,017,952 | 7,461,727 | 6,810,007 | 72,181 | 579,539 | 3,401,998 | 1,154,227 | 789,417 | 26,271 | 338,539 |
| 2021 | 11,517,140 | 7,153,148 | 6,500,688 | 68,576 | 583,884 | 3,288,349 | 1,075,643 | 725,409 | 24,251 | 325,983 |
| 2022 | 11,029,679 | 6,833,811 | 6,181,292 | 64,689 | 587,830 | 3,186,435 | 1,009,433 | 669,898 | 22,489 | 317,046 |
| 2023 | 10,604,333 | 6,564,962 | 5,910,562 | 61,154 | 593,246 | 3,089,400 | 949,971 | 617,915 | 20,819 | 311,237 |
| 2024 | 10,339,192 | 6,387,301 | 5,716,751 | 58,551 | 611,999 | 3,009,928 | 941,963 | 591,857 | 20,275 | 329,831 |
| 2025 | 10,102,172 | 6,238,345 | 5,551,560 | 56,420 | 630,365 | 2,942,402 | 921,425 | 563,632 | 19,448 | 338,345 |
| Total monthly benefits a (millions of dollars) | ||||||||||
| 1996 | 4,878 | 3,072 | -- | -- | -- | 1,222 | 584 | -- | -- | -- |
| 1997 | 5,106 | 3,245 | -- | -- | -- | 1,257 | 604 | -- | -- | -- |
| 1998 | 5,379 | 3,444 | -- | -- | -- | 1,313 | 622 | -- | -- | -- |
| 1999 | 5,680 | 3,691 | -- | -- | -- | 1,346 | 643 | -- | -- | -- |
| 2000 | 6,058 | 3,975 | -- | -- | -- | 1,408 | 675 | -- | -- | -- |
| 2001 | 6,509 | 4,299 | 3,976 | 65 | 258 | 1,491 | 719 | 530 | 22 | 167 |
| 2002 | 6,920 | 4,629 | 4,294 | 67 | 268 | 1,544 | 747 | 554 | 22 | 171 |
| 2003 | 7,416 | 5,024 | 4,674 | 69 | 281 | 1,603 | 790 | 592 | 22 | 176 |
| 2004 | 7,980 | 5,464 | 5,096 | 72 | 296 | 1,686 | 829 | 626 | 22 | 180 |
| 2005 | 8,604 | 5,974 | 5,584 | 75 | 315 | 1,724 | 906 | 696 | 22 | 187 |
| 2006 | 9,172 | 6,439 | 6,029 | 77 | 334 | 1,778 | 955 | 739 | 23 | 193 |
| 2007 | 9,734 | 6,817 | 6,389 | 77 | 351 | 1,886 | 1,031 | 805 | 23 | 203 |
| 2008 | 10,566 | 7,499 | 7,035 | 81 | 383 | 1,973 | 1,094 | 853 | 24 | 217 |
| 2009 | 11,155 | 7,924 | 7,447 | 82 | 396 | 2,122 | 1,108 | 863 | 24 | 221 |
| 2010 | 11,765 | 8,392 | 7,902 | 83 | 407 | 2,219 | 1,154 | 902 | 24 | 229 |
| 2011 | 12,526 | 9,037 | 8,562 | 86 | 390 | 2,299 | 1,189 | 941 | 24 | 224 |
| 2012 | 13,133 | 9,494 | 8,938 | 88 | 468 | 2,407 | 1,232 | 955 | 25 | 252 |
| 2013 | 13,420 | 9,747 | 9,176 | 89 | 482 | 2,474 | 1,200 | 918 | 25 | 257 |
| 2014 | 13,617 | 9,953 | 9,355 | 89 | 508 | 2,494 | 1,170 | 892 | 25 | 254 |
| 2015 | 13,596 | 9,936 | 9,325 | 89 | 521 | 2,520 | 1,140 | 857 | 25 | 258 |
| 2016 | 13,525 | 9,865 | 9,242 | 88 | 535 | 2,531 | 1,128 | 844 | 25 | 260 |
| 2017 | 13,626 | 9,953 | 9,305 | 89 | 559 | 2,536 | 1,138 | 845 | 26 | 267 |
| 2018 | 13,758 | 10,091 | 9,412 | 89 | 590 | 2,544 | 1,122 | 820 | 25 | 277 |
| 2019 | 13,745 | 10,098 | 9,398 | 88 | 612 | 2,578 | 1,069 | 763 | 24 | 281 |
| 2020 | 13,594 | 9,991 | 9,272 | 86 | 633 | 2,564 | 1,038 | 731 | 24 | 283 |
| 2021 | 13,662 | 10,150 | 9,385 | 87 | 679 | 2,508 | 1,004 | 697 | 23 | 284 |
| 2022 | 14,153 | 10,552 | 9,716 | 89 | 747 | 2,583 | 1,018 | 697 | 23 | 299 |
| 2023 | 14,220 | 10,465 | 9,596 | 87 | 782 | 2,732 | 1,024 | 691 | 22 | 311 |
| 2024 | 14,298 | 10,440 | 9,523 | 85 | 832 | 2,765 | 1,093 | 725 | 24 | 344 |
| 2025 | 14,372 | 10,507 | 9,535 | 85 | 887 | 2,795 | 1,070 | 689 | 22 | 358 |
| Average monthly benefit b (dollars) | ||||||||||
| 1996 | 624.80 | 744.60 | -- | -- | -- | 456.00 | 546.90 | -- | -- | -- |
| 1997 | 637.80 | 762.80 | -- | -- | -- | 458.10 | 557.10 | -- | -- | -- |
| 1998 | 649.90 | 775.00 | -- | -- | -- | 467.90 | 564.30 | -- | -- | -- |
| 1999 | 662.50 | 784.10 | -- | -- | -- | 477.60 | 576.70 | -- | -- | -- |
| 2000 | 689.30 | 818.80 | -- | -- | -- | 489.00 | 594.90 | -- | -- | -- |
| 2001 | 722.80 | 862.60 | 883.70 | 744.80 | 650.00 | 506.80 | 615.20 | 618.40 | 595.10 | 608.70 |
| 2002 | 744.40 | 884.60 | 905.40 | 764.40 | 666.00 | 522.50 | 625.20 | 626.90 | 608.30 | 622.20 |
| 2003 | 768.50 | 914.10 | 934.80 | 790.80 | 687.30 | 533.50 | 638.20 | 639.90 | 620.90 | 635.10 |
| 2004 | 796.80 | 947.80 | 967.80 | 804.80 | 722.50 | 545.90 | 655.20 | 657.10 | 639.10 | 651.40 |
| 2005 | 832.80 | 993.70 | 1,014.50 | 863.10 | 748.10 | 558.20 | 675.90 | 677.70 | 659.90 | 672.30 |
| 2006 | 867.90 | 1,036.50 | 1,057.60 | 900.00 | 781.70 | 578.30 | 697.40 | 699.20 | 680.70 | 693.20 |
| 2007 | 892.70 | 1,063.70 | 1,084.50 | 928.80 | 807.00 | 595.80 | 713.90 | 715.60 | 700.50 | 709.90 |
| 2008 | 940.40 | 1,128.50 | 1,149.80 | 991.10 | 860.60 | 607.70 | 746.80 | 749.70 | 733.70 | 738.60 |
| 2009 | 952.10 | 1,131.30 | 1,151.70 | 996.80 | 867.20 | 635.30 | 744.90 | 745.70 | 736.20 | 742.80 |
| 2010 | 959.00 | 1,140.80 | 1,160.40 | 1,005.20 | 877.00 | 636.90 | 744.20 | 745.00 | 737.00 | 742.20 |
| 2011 | 990.30 | 1,189.60 | 1,207.20 | 1,047.30 | 922.60 | 633.70 | 762.50 | 764.00 | 753.10 | 758.10 |
| 2012 | 1,010.85 | 1,207.16 | 1,225.63 | 1,069.08 | 955.26 | 657.17 | 776.17 | 776.83 | 771.12 | 774.48 |
| 2013 | 1,019.55 | 1,214.76 | 1,233.82 | 1,081.25 | 955.55 | 668.11 | 778.59 | 779.09 | 777.29 | 777.11 |
| 2014 | 1,033.08 | 1,233.18 | 1,252.43 | 1,099.94 | 977.32 | 671.28 | 780.63 | 782.82 | 785.57 | 773.33 |
| 2015 | 1,035.58 | 1,232.14 | 1,251.36 | 1,099.29 | 982.42 | 681.39 | 782.80 | 784.15 | 788.56 | 778.25 |
| 2016 | 1,037.54 | 1,235.70 | 1,255.19 | 1,101.49 | 989.95 | 681.24 | 782.76 | 784.48 | 787.40 | 777.44 |
| 2017 | 1,054.77 | 1,262.45 | 1,282.58 | 1,124.65 | 1,016.52 | 681.90 | 792.35 | 794.09 | 799.18 | 786.95 |
| 2018 | 1,082.97 | 1,299.31 | 1,320.47 | 1,156.20 | 1,050.30 | 693.67 | 809.39 | 811.11 | 814.77 | 804.51 |
| 2019 | 1,101.86 | 1,320.90 | 1,342.81 | 1,173.84 | 1,071.67 | 710.57 | 821.53 | 823.17 | 827.36 | 817.07 |
| 2020 | 1,116.57 | 1,339.07 | 1,361.64 | 1,191.54 | 1,092.01 | 722.53 | 831.28 | 832.92 | 838.39 | 826.93 |
| 2021 | 1,172.36 | 1,419.17 | 1,443.88 | 1,264.10 | 1,162.13 | 732.23 | 868.00 | 870.49 | 875.70 | 861.93 |
| 2022 | 1,268.43 | 1,544.04 | 1,571.85 | 1,376.00 | 1,270.07 | 778.33 | 938.12 | 940.78 | 947.58 | 931.87 |
| 2023 | 1,321.60 | 1,594.00 | 1,623.51 | 1,421.01 | 1,317.73 | 843.02 | 983.88 | 984.98 | 993.05 | 981.10 |
| 2024 | 1,357.39 | 1,634.45 | 1,665.68 | 1,457.58 | 1,359.54 | 870.95 | 1,016.38 | 1,014.53 | 1,028.55 | 1,018.89 |
| 2025 | 1,396.64 | 1,683.67 | 1,717.05 | 1,502.07 | 1,405.86 | 893.30 | 1,040.76 | 1,041.94 | 1,049.30 | 1,038.34 |
| SOURCES: Social Security Administration, Master Beneficiary Record and Supplemental Security Record, 100 percent data. | ||||||||||
| NOTES: Supplemental Security Income (SSI) counts include recipients of federal SSI, federally administered state supplementation, or both. Social Security beneficiaries who are entitled to a primary and a secondary benefit (dual entitlement) are counted only once in this table. | ||||||||||
| -- = not available. | ||||||||||
| a. Includes retroactive SSI payments. | ||||||||||
| b. Excludes retroactive payments for both programs. | ||||||||||
| CONTACT: statistics@ssa.gov. | ||||||||||
| State or area | Total | Workers | Widow(er)s | Adult children | ||||||||
|---|---|---|---|---|---|---|---|---|---|---|---|---|
| Total | Number with SSI | Average SSI benefit a (dollars) | Total | Number with SSI | Average SSI benefit a (dollars) | Total | Number with SSI | Average SSI benefit a (dollars) | Total | Number with SSI | Average SSI benefit a (dollars) | |
| All areas | 7,159,770 | 921,425 | 338.80 | 6,115,192 | 563,632 | 305.30 | 75,868 | 19,448 | 325.00 | 968,710 | 338,345 | 394.20 |
| Alabama | 178,606 | 23,351 | 306.50 | 154,914 | 13,914 | 274.40 | 2,527 | 651 | 287.00 | 21,165 | 8,786 | 358.10 |
| Alaska | 9,927 | 1,338 | 298.00 | 8,252 | 787 | 268.00 | 119 | 35 | 393.20 | 1,556 | 516 | 336.50 |
| Arizona | 125,036 | 12,418 | 319.60 | 107,819 | 7,183 | 289.80 | 1,128 | 223 | 296.90 | 16,089 | 5,012 | 362.30 |
| Arkansas | 115,329 | 14,898 | 306.60 | 100,691 | 9,044 | 275.40 | 1,641 | 484 | 302.60 | 12,997 | 5,370 | 358.80 |
| California | 502,662 | 111,077 | 463.30 | 408,859 | 65,956 | 410.00 | 4,862 | 1,590 | 475.80 | 88,941 | 43,531 | 542.50 |
| Colorado | 75,088 | 7,982 | 311.00 | 65,199 | 5,138 | 287.90 | 644 | 135 | 291.40 | 9,245 | 2,709 | 354.80 |
| Connecticut | 70,536 | 7,994 | 330.60 | 60,111 | 5,190 | 301.90 | 558 | 145 | 315.80 | 9,867 | 2,659 | 385.90 |
| Delaware | 22,801 | 1,933 | 332.50 | 20,093 | 1,215 | 309.50 | 176 | 32 | 285.10 | 2,532 | 686 | 374.70 |
| District of Columbia | 10,500 | 1,875 | 352.40 | 9,060 | 1,322 | 330.00 | 79 | 25 | 334.80 | 1,361 | 528 | 407.40 |
| Florida | 450,207 | 48,802 | 321.40 | 391,979 | 28,960 | 289.40 | 4,233 | 965 | 292.70 | 53,995 | 18,877 | 370.40 |
| Georgia | 234,276 | 29,429 | 308.10 | 201,771 | 17,371 | 278.50 | 3,086 | 794 | 314.00 | 29,419 | 11,264 | 351.60 |
| Hawaii | 18,356 | 1,984 | 400.30 | 15,537 | 1,125 | 349.40 | 154 | 37 | 343.20 | 2,665 | 822 | 470.60 |
| Idaho | 39,445 | 4,969 | 327.80 | 33,492 | 2,894 | 289.70 | 295 | 60 | 257.30 | 5,658 | 2,015 | 384.10 |
| Illinois | 233,355 | 28,604 | 328.40 | 194,932 | 17,610 | 304.40 | 2,067 | 494 | 322.50 | 36,356 | 10,500 | 368.00 |
| Indiana | 173,671 | 18,804 | 323.60 | 150,797 | 12,140 | 297.40 | 1,764 | 405 | 329.10 | 21,110 | 6,259 | 372.70 |
| Iowa | 71,359 | 9,274 | 320.30 | 61,164 | 6,030 | 294.00 | 629 | 171 | 338.50 | 9,566 | 3,073 | 369.90 |
| Kansas | 60,461 | 7,638 | 318.40 | 51,384 | 4,750 | 289.40 | 542 | 145 | 333.00 | 8,535 | 2,743 | 367.00 |
| Kentucky | 163,950 | 23,589 | 316.50 | 141,314 | 14,179 | 282.00 | 3,168 | 1,011 | 311.90 | 19,468 | 8,399 | 374.50 |
| Louisiana | 131,473 | 20,612 | 330.90 | 109,774 | 12,102 | 295.70 | 2,201 | 538 | 323.80 | 19,498 | 7,972 | 384.30 |
| Maine | 45,894 | 6,600 | 318.60 | 39,064 | 3,888 | 274.20 | 407 | 101 | 334.00 | 6,423 | 2,611 | 383.30 |
| Maryland | 103,337 | 11,707 | 324.70 | 88,447 | 7,486 | 300.80 | 801 | 175 | 318.20 | 14,089 | 4,046 | 367.80 |
| Massachusetts | 154,205 | 19,147 | 324.10 | 130,985 | 11,743 | 281.00 | 1,061 | 263 | 332.10 | 22,159 | 7,141 | 393.60 |
| Michigan | 283,912 | 37,211 | 331.50 | 240,361 | 22,890 | 295.00 | 2,812 | 695 | 317.40 | 40,739 | 13,626 | 392.70 |
| Minnesota | 108,710 | 12,570 | 309.90 | 94,321 | 8,550 | 287.40 | 561 | 136 | 306.70 | 13,828 | 3,884 | 358.80 |
| Mississippi | 105,219 | 16,448 | 315.40 | 88,900 | 9,100 | 282.50 | 1,536 | 470 | 306.50 | 14,783 | 6,878 | 358.50 |
| Missouri | 175,852 | 21,480 | 321.80 | 152,279 | 13,460 | 294.90 | 2,062 | 604 | 317.30 | 21,511 | 7,416 | 370.20 |
| Montana | 21,946 | 2,826 | 306.00 | 18,967 | 1,855 | 284.90 | 210 | 52 | 322.20 | 2,769 | 919 | 346.60 |
| Nebraska | 37,883 | 5,160 | 307.90 | 32,110 | 3,319 | 286.50 | 253 | 66 | 288.90 | 5,520 | 1,775 | 347.80 |
| Nevada | 52,954 | 5,073 | 319.40 | 46,914 | 3,218 | 296.70 | 536 | 86 | 356.80 | 5,504 | 1,769 | 358.10 |
| New Hampshire | 38,926 | 3,062 | 312.60 | 34,126 | 1,809 | 277.20 | 234 | 42 | 320.60 | 4,566 | 1,211 | 364.30 |
| New Jersey | 158,148 | 16,716 | 331.70 | 133,464 | 10,252 | 296.30 | 1,163 | 251 | 289.30 | 23,521 | 6,213 | 390.50 |
| New Mexico | 51,940 | 7,365 | 317.90 | 45,160 | 4,643 | 283.90 | 473 | 133 | 325.80 | 6,307 | 2,589 | 378.20 |
| New York | 419,421 | 55,645 | 326.50 | 352,912 | 34,302 | 294.50 | 3,342 | 951 | 339.90 | 63,167 | 20,392 | 378.80 |
| North Carolina | 274,322 | 32,011 | 312.80 | 237,602 | 19,103 | 286.40 | 3,201 | 849 | 300.20 | 33,519 | 12,059 | 354.40 |
| North Dakota | 13,559 | 1,593 | 321.80 | 11,677 | 1,048 | 295.60 | 91 | 24 | 460.40 | 1,791 | 521 | 366.00 |
| Ohio | 301,527 | 40,949 | 329.00 | 259,480 | 26,908 | 299.70 | 3,899 | 1,061 | 316.90 | 38,148 | 12,980 | 389.60 |
| Oklahoma | 111,958 | 14,166 | 322.80 | 97,612 | 9,141 | 295.40 | 1,535 | 386 | 328.20 | 12,811 | 4,639 | 375.40 |
| Oregon | 88,140 | 11,087 | 312.50 | 75,060 | 6,968 | 284.70 | 933 | 234 | 290.40 | 12,147 | 3,885 | 362.80 |
| Pennsylvania | 336,698 | 41,983 | 336.80 | 289,790 | 26,519 | 307.20 | 3,126 | 774 | 307.60 | 43,782 | 14,690 | 391.10 |
| Rhode Island | 30,666 | 4,438 | 321.50 | 26,549 | 2,876 | 287.70 | 198 | 54 | 301.00 | 3,919 | 1,508 | 385.70 |
| South Carolina | 147,313 | 14,830 | 317.00 | 128,388 | 8,740 | 293.30 | 1,844 | 430 | 290.60 | 17,081 | 5,660 | 354.20 |
| South Dakota | 17,117 | 2,283 | 322.80 | 14,800 | 1,438 | 296.70 | 109 | 32 | 279.60 | 2,208 | 813 | 368.60 |
| Tennessee | 200,726 | 24,287 | 319.80 | 173,992 | 14,502 | 287.70 | 2,976 | 956 | 306.00 | 23,758 | 8,829 | 372.80 |
| Texas | 462,831 | 62,048 | 318.60 | 393,382 | 36,710 | 287.90 | 5,068 | 1,157 | 312.90 | 64,381 | 24,181 | 364.80 |
| Utah | 42,582 | 4,677 | 324.30 | 35,668 | 2,887 | 297.90 | 323 | 72 | 316.60 | 6,591 | 1,718 | 367.80 |
| Vermont | 18,615 | 2,934 | 326.40 | 16,004 | 1,895 | 291.60 | 122 | 36 | 344.40 | 2,489 | 1,003 | 391.10 |
| Virginia | 178,747 | 19,941 | 319.20 | 154,553 | 12,291 | 296.10 | 1,947 | 504 | 294.10 | 22,247 | 7,146 | 360.10 |
| Washington | 133,268 | 16,138 | 315.40 | 113,084 | 10,042 | 280.80 | 1,256 | 276 | 318.00 | 18,928 | 5,820 | 373.30 |
| West Virginia | 70,204 | 9,997 | 326.10 | 59,528 | 5,983 | 298.00 | 1,386 | 394 | 301.20 | 9,290 | 3,620 | 374.60 |
| Wisconsin | 137,265 | 19,103 | 313.70 | 117,435 | 12,252 | 281.70 | 841 | 221 | 320.40 | 18,989 | 6,630 | 371.80 |
| Wyoming | 11,463 | 1,287 | 308.40 | 10,066 | (X) | (X) | 93 | (X) | (X) | 1,304 | 402 | 341.10 |
| Outlying areas b | 137,384 | 92 | 387.40 | 115,370 | (X) | (X) | 1,596 | (X) | (X) | 20,418 | 50 | 412.80 |
| SOURCES: Social Security Administration, Master Beneficiary Record and Supplemental Security Record, 100 percent data. | ||||||||||||
| NOTES: Supplemental Security Income (SSI) counts include recipients of federal SSI, federally administered state supplementation, or both. Social Security beneficiaries who are entitled to a primary and a secondary benefit (dual entitlement) are counted only once in this table. | ||||||||||||
| (X) = suppressed to avoid disclosing information about particular individuals. | ||||||||||||
| a. Excludes retroactive payments. | ||||||||||||
| b. Includes American Samoa, Guam, Northern Mariana Islands, Puerto Rico, U.S. Virgin Islands, and foreign countries. | ||||||||||||
| CONTACT: statistics@ssa.gov. | ||||||||||||
| State | Resident population a | Beneficiaries | |
|---|---|---|---|
| Number | Percentage of resident population | ||
| United States | 205,146,421 | 9,964,299 | 4.9 |
| Alabama | 3,065,347 | 242,630 | 7.9 |
| Alaska | 449,378 | 14,661 | 3.3 |
| Arizona | 4,454,730 | 172,346 | 3.9 |
| Arkansas | 1,824,057 | 156,296 | 8.6 |
| California | 24,279,343 | 821,028 | 3.4 |
| Colorado | 3,763,170 | 104,311 | 2.8 |
| Connecticut | 2,218,356 | 99,167 | 4.5 |
| Delaware | 608,642 | 30,439 | 5.0 |
| District of Columbia | 475,152 | 20,531 | 4.3 |
| Florida | 13,673,008 | 618,211 | 4.5 |
| Georgia | 6,912,638 | 336,513 | 4.9 |
| Hawaii | 826,953 | 26,487 | 3.2 |
| Idaho | 1,178,474 | 53,192 | 4.5 |
| Illinois | 7,721,395 | 336,598 | 4.4 |
| Indiana | 4,112,733 | 232,531 | 5.7 |
| Iowa | 1,869,083 | 93,767 | 5.0 |
| Kansas | 1,733,133 | 80,653 | 4.7 |
| Kentucky | 2,722,062 | 233,638 | 8.6 |
| Louisiana | 2,700,009 | 198,924 | 7.4 |
| Maine | 823,012 | 60,991 | 7.4 |
| Maryland | 3,778,621 | 154,847 | 4.1 |
| Massachusetts | 4,404,717 | 218,177 | 5.0 |
| Michigan | 5,988,647 | 394,385 | 6.6 |
| Minnesota | 3,433,519 | 147,359 | 4.3 |
| Mississippi | 1,724,376 | 150,549 | 8.7 |
| Missouri | 3,680,279 | 234,910 | 6.4 |
| Montana | 659,269 | 28,677 | 4.3 |
| Nebraska | 1,170,426 | 50,291 | 4.3 |
| Nevada | 2,004,452 | 74,821 | 3.7 |
| New Hampshire | 844,894 | 46,882 | 5.5 |
| New Jersey | 5,790,039 | 217,874 | 3.8 |
| New Mexico | 1,237,793 | 74,690 | 6.0 |
| New York | 12,236,485 | 611,743 | 5.0 |
| North Carolina | 6,718,588 | 372,587 | 5.5 |
| North Dakota | 473,249 | 17,165 | 3.6 |
| Ohio | 6,970,474 | 436,371 | 6.3 |
| Oklahoma | 2,424,502 | 157,387 | 6.5 |
| Oregon | 2,563,204 | 126,915 | 5.0 |
| Pennsylvania | 7,689,011 | 476,091 | 6.2 |
| Rhode Island | 683,806 | 43,671 | 6.4 |
| South Carolina | 3,248,575 | 194,059 | 6.0 |
| South Dakota | 533,870 | 22,962 | 4.3 |
| Tennessee | 4,378,761 | 274,016 | 6.3 |
| Texas | 19,397,926 | 682,755 | 3.5 |
| Utah | 2,156,458 | 57,832 | 2.7 |
| Vermont | 379,760 | 24,751 | 6.5 |
| Virginia | 5,385,911 | 245,987 | 4.6 |
| Washington | 4,905,621 | 193,507 | 3.9 |
| West Virginia | 1,023,609 | 101,357 | 9.9 |
| Wisconsin | 3,509,133 | 183,960 | 5.2 |
| Wyoming | 339,771 | 14,807 | 4.4 |
| SOURCES: Social Security Administration, Master Beneficiary Record and Supplemental Security Record, 100 percent data; Census Bureau, 2025 estimates of resident population. | |||
| NOTES: Data exclude United States territories and other areas. | |||
| Supplemental Security Income (SSI) counts include recipients of federal SSI, federally administered state supplementation, or both. Social Security beneficiaries who are entitled to a primary and a secondary benefit (dual entitlement) are counted only once in this table. | |||
| a. Population estimates for the United States as of July 1, 2025, as reported by the Census Bureau. | |||
| CONTACT: statistics@ssa.gov. | |||
| Diagnostic group | Total | Social Security only | SSI only | Both Social Security and SSI | ||||
|---|---|---|---|---|---|---|---|---|
| Workers | Widow(er)s | Adult children | Workers | Widow(er)s | Adult children | |||
| Number | ||||||||
| Total | 10,102,172 | 5,551,560 | 56,420 | 630,365 | 2,942,402 | 563,632 | 19,448 | 338,345 |
| Congenital anomalies | 109,628 | 13,665 | 62 | 27,435 | 52,328 | 2,782 | 25 | 13,331 |
| Endocrine, nutritional, and metabolic diseases | 183,763 | 120,143 | 1,651 | 2,228 | 46,098 | 11,633 | 641 | 1,369 |
| Infectious and parasitic diseases | 87,668 | 56,179 | 385 | 921 | 23,008 | 6,145 | 156 | 874 |
| Injuries | 321,271 | 220,293 | 1,368 | 9,177 | 69,677 | 16,714 | 429 | 3,613 |
| Mental disorders | ||||||||
| Autism spectrum disorders | 378,230 | 31,653 | 9 | 77,561 | 221,462 | 10,556 | 4 | 36,985 |
| Developmental disorders | 55,206 | 7,049 | 64 | 5,153 | 36,704 | 2,306 | 36 | 3,894 |
| Childhood and adolescent disorders not elsewhere classified | 11,241 | 1,559 | 8 | 918 | 7,617 | 455 | 4 | 680 |
| Intellectual disorders | 1,208,967 | 184,881 | 1,720 | 264,053 | 531,071 | 72,790 | 1,717 | 152,735 |
| Depressive, bipolar, and related disorders | 1,156,952 | 639,327 | 6,499 | 35,438 | 355,131 | 96,522 | 2,872 | 21,163 |
| Neurocognitive disorders | 293,491 | 162,937 | 959 | 19,788 | 82,274 | 17,211 | 407 | 9,915 |
| Schizophrenia spectrum and other psychotic disorders | 597,131 | 227,023 | 1,397 | 40,597 | 246,846 | 58,845 | 758 | 21,665 |
| Other mental disorders | 581,294 | 263,788 | 2,274 | 31,550 | 222,482 | 39,233 | 1,002 | 20,965 |
| Neoplasms | 279,712 | 227,769 | 1,521 | 1,909 | 37,740 | 9,563 | 299 | 911 |
| Diseases of the— | ||||||||
| Blood and blood-forming organs | 31,985 | 15,984 | 102 | 1,539 | 11,000 | 2,099 | 26 | 1,235 |
| Circulatory system | 589,385 | 428,650 | 4,196 | 3,365 | 124,723 | 25,707 | 1,273 | 1,471 |
| Digestive system | 128,453 | 95,106 | 720 | 1,156 | 24,724 | 6,030 | 199 | 518 |
| Genitourinary system | 176,682 | 132,482 | 684 | 1,463 | 33,159 | 7,799 | 209 | 886 |
| Musculoskeletal system and connective tissue | 2,478,896 | 1,875,292 | 25,019 | 7,330 | 445,816 | 114,283 | 7,000 | 4,156 |
| Nervous system and sense organs | 1,032,616 | 606,925 | 4,132 | 81,370 | 254,560 | 47,305 | 1,120 | 37,204 |
| Respiratory system | 213,534 | 139,392 | 3,050 | 873 | 56,651 | 11,933 | 1,048 | 587 |
| Skin and subcutaneous tissue | 21,776 | 14,631 | 98 | 390 | 5,018 | 1,368 | 31 | 240 |
| Other | 20,307 | 7,355 | 47 | 2,302 | 8,477 | 652 | 12 | 1,462 |
| Unknown | 143,984 | 79,477 | 455 | 13,849 | 45,836 | 1,701 | 180 | 2,486 |
| Percent | ||||||||
| Total | 100.0 | 100.0 | 100.0 | 100.0 | 100.0 | 100.0 | 100.0 | 100.0 |
| Congenital anomalies | 1.1 | 0.2 | 0.1 | 4.4 | 1.8 | 0.5 | 0.1 | 3.9 |
| Endocrine, nutritional, and metabolic diseases | 1.8 | 2.2 | 2.9 | 0.4 | 1.6 | 2.1 | 3.3 | 0.4 |
| Infectious and parasitic diseases | 0.9 | 1.0 | 0.7 | 0.1 | 0.8 | 1.1 | 0.8 | 0.3 |
| Injuries | 3.2 | 4.0 | 2.4 | 1.5 | 2.4 | 3.0 | 2.2 | 1.1 |
| Mental disorders | ||||||||
| Autism spectrum disorders | 3.7 | 0.6 | (L) | 12.3 | 7.5 | 1.9 | (L) | 10.9 |
| Developmental disorders | 0.5 | 0.1 | 0.1 | 0.8 | 1.2 | 0.4 | 0.2 | 1.2 |
| Childhood and adolescent disorders not elsewhere classified | 0.1 | (L) | (L) | 0.1 | 0.3 | 0.1 | (L) | 0.2 |
| Intellectual disorders | 12.0 | 3.3 | 3.0 | 41.9 | 18.0 | 12.9 | 8.8 | 45.1 |
| Depressive, bipolar, and related disorders | 11.5 | 11.5 | 11.5 | 5.6 | 12.1 | 17.1 | 14.8 | 6.3 |
| Neurocognitive disorders | 2.9 | 2.9 | 1.7 | 3.1 | 2.8 | 3.1 | 2.1 | 2.9 |
| Schizophrenia spectrum and other psychotic disorders | 5.9 | 4.1 | 2.5 | 6.4 | 8.4 | 10.4 | 3.9 | 6.4 |
| Other mental disorders | 5.8 | 4.8 | 4.0 | 5.0 | 7.6 | 7.0 | 5.2 | 6.2 |
| Neoplasms | 2.8 | 4.1 | 2.7 | 0.3 | 1.3 | 1.7 | 1.5 | 0.3 |
| Diseases of the— | ||||||||
| Blood and blood-forming organs | 0.3 | 0.3 | 0.2 | 0.2 | 0.4 | 0.4 | 0.1 | 0.4 |
| Circulatory system | 5.8 | 7.7 | 7.4 | 0.5 | 4.2 | 4.6 | 6.5 | 0.4 |
| Digestive system | 1.3 | 1.7 | 1.3 | 0.2 | 0.8 | 1.1 | 1.0 | 0.2 |
| Genitourinary system | 1.7 | 2.4 | 1.2 | 0.2 | 1.1 | 1.4 | 1.1 | 0.3 |
| Musculoskeletal system and connective tissue | 24.5 | 33.8 | 44.3 | 1.2 | 15.2 | 20.3 | 36.0 | 1.2 |
| Nervous system and sense organs | 10.2 | 10.9 | 7.3 | 12.9 | 8.7 | 8.4 | 5.8 | 11.0 |
| Respiratory system | 2.1 | 2.5 | 5.4 | 0.1 | 1.9 | 2.1 | 5.4 | 0.2 |
| Skin and subcutaneous tissue | 0.2 | 0.3 | 0.2 | 0.1 | 0.2 | 0.2 | 0.2 | 0.1 |
| Other | 0.2 | 0.1 | 0.1 | 0.4 | 0.3 | 0.1 | 0.1 | 0.4 |
| Unknown | 1.4 | 1.4 | 0.8 | 2.2 | 1.6 | 0.3 | 0.9 | 0.7 |
| SOURCES: Social Security Administration, Master Beneficiary Record and Supplemental Security Record, 100 percent data. | ||||||||
| NOTES: Supplemental Security Income (SSI) counts include recipients of federal SSI, federally administered state supplementation, or both. Social Security beneficiaries who are entitled to a primary and a secondary benefit (dual entitlement) are counted only once in this table. | ||||||||
| (L) = less than 0.05 percent. | ||||||||
| CONTACT: statistics@ssa.gov. | ||||||||