Trends in the Social Security and Supplemental Security Income Disability Programs
Population Factors Influencing Program Size
Introduction
Various factors affect the size of the disability programs. One factor is population growth. As the size of the population increases, other things remaining the same, one would expect that the size of the disability programs would increase proportionately, although it is rare for all other factors to stay the same. Another factor is change in the eligible population, which can be the result of changes in program eligibility criteria (for example, increases in the full retirement age result in disabled workers staying in the Disability Insurance program longer) or changes in the population vis-à-vis eligibility (for example, a greater proportion of workers being insured for disability). A final factor that influences program size is the incidence and prevalence of disability in the population.1
A number of factors influence incidence and prevalence rates of disability in the general population. One is the general health of the population and the incidence rates for disease and disabling impairments. Another is the social environment that leads a person with an impairment to be disabled. Contributing factors may include economic conditions, social mores, environmental factors, and financial incentives such as benefits. Demographic trends (such as the aging of the baby boomers) also play a role. However, the incidence rate is not simply a function of the factors discussed above but is also affected by the standards and methods that the Social Security Administration applies in determining medical eligibility. As the decision process becomes more or less stringent, the number of persons entering the disability programs changes. Similarly, perceived changes in the standards that SSA applies to medical decisions may influence the decision to apply for disability benefits.
Population Growth
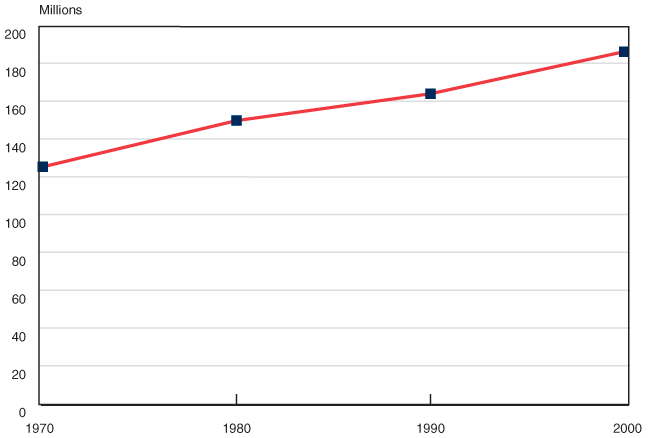
Between 1970 and 2000, the population of the United States aged 15–64 increased by nearly 50 percent. This increase made a major contribution to growth in the disability programs.
| Year | Population |
|---|---|
| 1970 | 125.25 |
| 1980 | 149.71 |
| 1990 | 163.90 |
| 2000 | 186.18 |
The working-age population of the United States (ages 15–64) grew 49 percent between 1970 and 2000, from 125 million to 186 million. Over that same period, the number of disabled-worker beneficiaries increased nearly 240 percent, from 1.5 million to more than 5 million. The Supplemental Security Income program did not exist until 1974, but the population of blind and disabled adult SSI recipients aged 18–64 increased 150 percent, from 1.5 million in 1974 to 3.7 million in 2000. Many things have changed that alter the direct relationship between the size of the population and the size of the disability rolls: the change in the age distribution due to the baby boomers, the health of the population, improvements in medical treatments, economic circumstances, and changes in disability policy, to name a few.
Number of Workers Insured for Disability
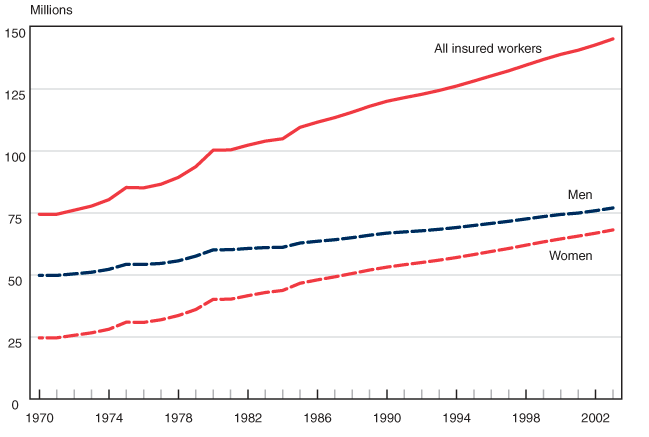
The number of workers insured in the event of disability increased by 95 percent from 1970 to 2003, nearly twice the rate of population growth. The number insured for disability is increasing more rapidly for women than for men, reflecting the emergence of the two-earner household and increased participation in the labor force by women.
| Year | Men | Women | All insured workers |
|---|---|---|---|
| 1970 | 49.85 | 24.66 | 74.50 |
| 1971 | 49.84 | 24.66 | 74.50 |
| 1972 | 50.46 | 25.68 | 76.14 |
| 1973 | 51.12 | 26.68 | 77.80 |
| 1974 | 52.29 | 28.11 | 80.40 |
| 1975 | 54.32 | 30.98 | 85.31 |
| 1976 | 54.27 | 30.88 | 85.15 |
| 1977 | 54.67 | 31.95 | 86.62 |
| 1978 | 55.71 | 33.67 | 89.38 |
| 1979 | 57.62 | 36.08 | 93.70 |
| 1980 | 60.14 | 40.19 | 100.33 |
| 1981 | 60.21 | 40.24 | 100.45 |
| 1982 | 60.70 | 41.66 | 102.36 |
| 1983 | 61.06 | 42.94 | 104.00 |
| 1984 | 61.18 | 43.77 | 104.96 |
| 1985 | 62.90 | 46.68 | 109.57 |
| 1986 | 63.61 | 48.04 | 111.65 |
| 1987 | 64.23 | 49.27 | 113.50 |
| 1988 | 65.07 | 50.61 | 115.68 |
| 1989 | 66.05 | 52.01 | 118.06 |
| 1990 | 66.90 | 53.18 | 120.08 |
| 1991 | 67.38 | 54.15 | 121.53 |
| 1992 | 67.84 | 55.05 | 122.88 |
| 1993 | 68.44 | 56.00 | 124.43 |
| 1994 | 69.15 | 57.06 | 126.21 |
| 1995 | 69.98 | 58.25 | 128.23 |
| 1996 | 70.82 | 59.50 | 130.32 |
| 1997 | 71.66 | 60.70 | 132.36 |
| 1998 | 72.61 | 62.04 | 134.65 |
| 1999 | 73.56 | 63.36 | 136.92 |
| 2000 | 74.42 | 64.57 | 138.99 |
| 2001 | 74.98 | 65.69 | 140.67 |
| 2002 | 75.95 | 66.87 | 142.81 |
| 2003 | 77.04 | 68.19 | 145.23 |
Although the growth of the population plays a role in the size of SSA's disability programs, potential participants in the Disability Insurance program must be insured in the event of disability. The number of persons insured has increased steadily from 1970 to 2003, rising by 95 percent—nearly double the 49 percent growth in the population. This growth indicates that the DI program is likely to grow faster than the population, because workers are being insured for disability at proportionately higher rates.
The number of women insured in the event of disability has increased by 176 percent during the period, compared with 55 percent (about the rate of population growth) for men. The larger increase in the number of women insured for disability can be attributed to the emergence of the two-earner household and stronger labor force attachment for women than in the past.
Prevalence of Work Disability
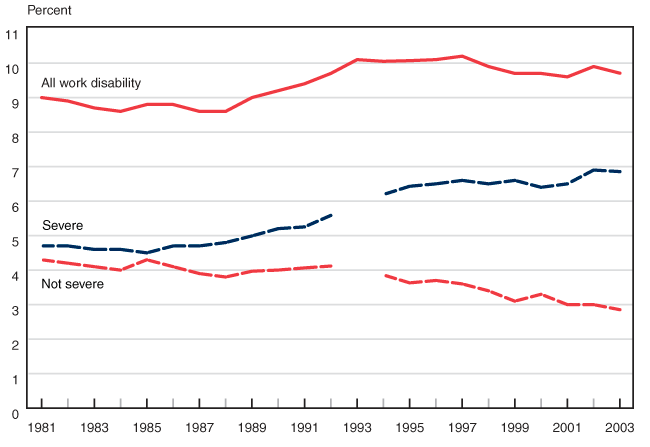
After increasing from 9 percent of the population in 1981 to 10 percent in 1993, the percentage of the working-age population (16–64) reporting a work disability has been fairly stable at around 10 percent from 1993 until 2003, declining slightly after 1997. However, the percentage of the working-age population reporting a severe work disability has increased from less than 5 percent in 1981 to nearly 7 percent in 2003.
| Year | All work disability |
Not severe | Severe |
|---|---|---|---|
| 1981 | 9.00 | 4.30 | 4.70 |
| 1982 | 8.90 | 4.20 | 4.70 |
| 1983 | 8.70 | 4.10 | 4.60 |
| 1984 | 8.60 | 4.00 | 4.60 |
| 1985 | 8.80 | 4.30 | 4.50 |
| 1986 | 8.80 | 4.10 | 4.70 |
| 1987 | 8.60 | 3.90 | 4.70 |
| 1988 | 8.60 | 3.80 | 4.80 |
| 1989 | 9.00 | 3.97 | 4.99 |
| 1990 | 9.20 | 4.00 | 5.20 |
| 1991 | 9.40 | 4.06 | 5.25 |
| 1992 | 9.70 | 4.12 | 5.58 |
| 1993 | 10.10 | -- | -- |
| 1994 | 10.05 | 3.86 | 6.19 |
| 1995 | 10.07 | 3.63 | 6.43 |
| 1996 | 10.10 | 3.70 | 6.50 |
| 1997 | 10.20 | 3.60 | 6.60 |
| 1998 | 9.90 | 3.40 | 6.50 |
| 1999 | 9.70 | 3.10 | 6.60 |
| 2000 | 9.70 | 3.30 | 6.40 |
| 2001 | 9.60 | 3.00 | 6.50 |
| 2002 | 9.90 | 3.00 | 6.90 |
| 2003 | 9.71 | 2.85 | 6.85 |
Obtaining a good, consistent measure of the disabled population in the United States is difficult. Different surveys use different definitions of disability and, depending on the context of the questions, respondents formulate their answers differently. Even when surveys use the same definition of disability, the estimates can differ. Given those caveats, the Current Population Survey permits one to track work disability on an annual basis using comparable measures. According to the CPS data, work disability increased slightly during the late 1980s and early 1990s, before moderating some in the late 1990s.
Perhaps most striking is the continuing increase in the percentage reporting a severe work disability since 1985 (from less than 5 percent of the population to nearly 7 percent), along with a corresponding drop in the percentage reporting a nonsevere work disability. The increase in severe work disability that occurred while the overall prevalence of work disability remained relatively constant suggests that persons are viewing their impairments as more disabling. This is significant because persons with severe work disabilities are those most likely to seek benefits from SSA's disability programs.
Disabled-Worker Incidence Rates
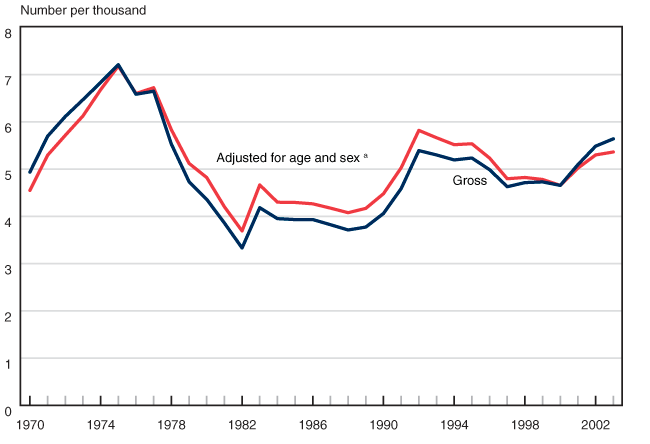
Disabled-worker incidence rates varied considerably from 1970 to 2003. Incidence rates adjusted for age and sex closely track gross incidence rates, indicating that trends in the incidence of disability cannot be accounted for by the aging of the population or the greater presence of women in the workforce.
| Year | Gross | Adjusted for age and sex a |
|---|---|---|
| 1970 | 4.94 | 4.55 |
| 1971 | 5.70 | 5.30 |
| 1972 | 6.12 | 5.72 |
| 1973 | 6.47 | 6.13 |
| 1974 | 6.84 | 6.68 |
| 1975 | 7.21 | 7.19 |
| 1976 | 6.59 | 6.60 |
| 1977 | 6.65 | 6.73 |
| 1978 | 5.53 | 5.84 |
| 1979 | 4.74 | 5.12 |
| 1980 | 4.36 | 4.82 |
| 1981 | 3.86 | 4.21 |
| 1982 | 3.33 | 3.69 |
| 1983 | 4.19 | 4.67 |
| 1984 | 3.95 | 4.30 |
| 1985 | 3.93 | 4.30 |
| 1986 | 3.93 | 4.27 |
| 1987 | 3.83 | 4.18 |
| 1988 | 3.71 | 4.08 |
| 1989 | 3.78 | 4.17 |
| 1990 | 4.06 | 4.48 |
| 1991 | 4.59 | 5.03 |
| 1992 | 5.39 | 5.82 |
| 1993 | 5.30 | 5.67 |
| 1994 | 5.20 | 5.52 |
| 1995 | 5.24 | 5.54 |
| 1996 | 4.99 | 5.24 |
| 1997 | 4.63 | 4.80 |
| 1998 | 4.72 | 4.83 |
| 1999 | 4.73 | 4.78 |
| 2000 | 4.66 | 4.66 |
| 2001 | 5.10 | 5.02 |
| 2002 | 5.49 | 5.30 |
| 2003 | 5.64 | 5.37 |
The gross and age-sex adjusted incidence rates measuring the rate of entry into the DI worker program from the disability-insured population show considerable variation between 1970 and 2003. There is also a significant trend in the age distribution of the population: the population bulge of baby boomers (persons born between 1946 and 1964 and aged 39–59 in 2005) is reaching the age at which the rate of disabilities increases. To the extent that sex and age play a role in disability, gross incidence rates may lead to incorrect conclusions about the actual incidence of disabling conditions. For that reason, incidence rates adjusted for age and sex provide a better indication of the trend in disability.
Incidence rates adjusted for age and sex closely track gross incidence rates for the 1970–2003 period. Although the gross incidence rate sometimes exceeds the adjusted rate, and vice versa, the similar patterns of the two trends over time indicate that trends in the incidence of disability cannot be accounted for solely by the aging of the population and increasing presence of women in the workforce. Instead, the greater impact on incidence rates appears to come from other factors including, among other things, program administration and the economy.
SSI Blind and Disabled Incidence Rates
The rate of entry of blind and disabled SSI recipients, regardless of age, increased in the late 1980s and early 1990s, showing that population growth and a changing age distribution cannot explain all of the growth of the SSI program.
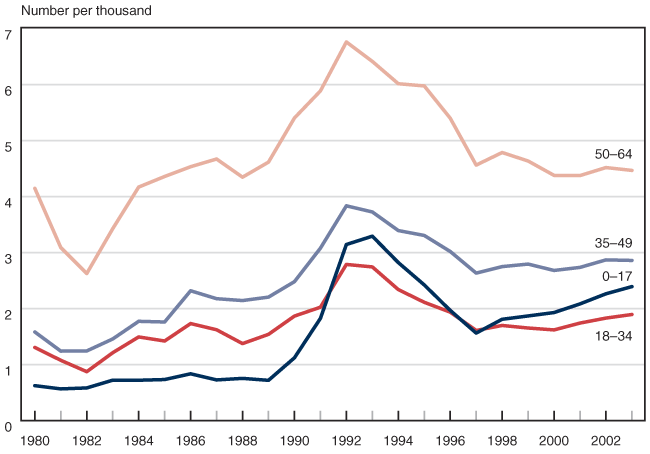
| Year | 0–17 | 18–34 | 35–49 | 50–64 |
|---|---|---|---|---|
| 1980 | 0.62 | 1.31 | 1.58 | 4.15 |
| 1981 | 0.57 | 1.08 | 1.24 | 3.09 |
| 1982 | 0.58 | 0.87 | 1.24 | 2.63 |
| 1983 | 0.72 | 1.21 | 1.46 | 3.43 |
| 1984 | 0.72 | 1.49 | 1.77 | 4.17 |
| 1985 | 0.73 | 1.42 | 1.76 | 4.36 |
| 1986 | 0.84 | 1.73 | 2.32 | 4.53 |
| 1987 | 0.73 | 1.62 | 2.18 | 4.67 |
| 1988 | 0.75 | 1.37 | 2.14 | 4.35 |
| 1989 | 0.72 | 1.54 | 2.20 | 4.61 |
| 1990 | 1.12 | 1.87 | 2.48 | 5.40 |
| 1991 | 1.82 | 2.02 | 3.08 | 5.89 |
| 1992 | 3.14 | 2.79 | 3.83 | 6.76 |
| 1993 | 3.29 | 2.74 | 3.72 | 6.41 |
| 1994 | 2.82 | 2.34 | 3.39 | 6.01 |
| 1995 | 2.42 | 2.11 | 3.31 | 5.98 |
| 1996 | 1.97 | 1.94 | 3.02 | 5.40 |
| 1997 | 1.56 | 1.61 | 2.63 | 4.56 |
| 1998 | 1.81 | 1.70 | 2.75 | 4.79 |
| 1999 | 1.87 | 1.65 | 2.79 | 4.63 |
| 2000 | 1.93 | 1.62 | 2.68 | 4.38 |
| 2001 | 2.08 | 1.74 | 2.74 | 4.37 |
| 2002 | 2.26 | 1.83 | 2.87 | 4.52 |
| 2003 | 2.39 | 1.89 | 2.86 | 4.47 |
The change in incidence for the SSI disability program was examined by comparing blind and disabled SSI entrants per 1,000 persons in the population in various age groups. As expected, incidence rates of SSI disability vary over time. In contrast, incidence rates within each of the age groups tend to follow the same pattern over time. That pattern is similar to the one found for the DI program, with declines in the early 1980s, followed by increases in the late 1980s and early 1990s. The pattern clearly shows that factors other than population growth and a changing age distribution are affecting the growth of the SSI disability program.
Note
1. Incidence is a flow concept, indicating the number of persons entering a state, such as the number who become impaired or the number of new entrants to a disability program. Prevalence is a stock concept, indicating the cumulative number in a state, in this case the number of persons with impairments (new and existing) or the number of persons on the disability rolls (new entrants and existing disabled beneficiaries.)