Trends in Working and Claiming Behavior at Social Security's Early Eligibility Age by Sex
ORES Working Paper No. 114 (released August 2020)
For this working paper, I use a merged internal research file of administrative data from the Social Security Administration to examine working and retired-worker benefit claiming behavior at and around Social Security's early eligibility age of 62, by sex. I define various combinations of working and benefit-claiming behavior at or near age 62, for which I present statistics indicating trends in behavior patterns for men and women born in the years from 1937 through 1944. This paper is an introductory companion to the forthcoming ORES Working Paper No. 115, which focuses on men's working and claiming behavior, disaggregates the results by lifetime earnings decile, and measures the relative mortality risk of those behaviors.
When this paper was written, the author was with the Office of Research, Office of Research, Evaluation, and Statistics, Office of Retirement and Disability Policy, Social Security Administration.
Acknowledgments: The author would like to thank Chris Chaplain, John Jankowski, Anya Olsen, David Olson, David Pattison, Katie Sutton, and Elisa Walker for their helpful comments and suggestions.
Working papers are unedited papers prepared by staff in the Office of Research, Evaluation, and Statistics and published on our website as a resource for future research initiatives and to encourage discussion among the wider research community. The findings and conclusions presented in this paper are those of the author and do not necessarily represent the views of the Social Security Administration.
Introduction
| AWI | average wage index |
| CWHS | Continuous Work History Sample |
| EEA | early eligibility age |
| FRA | full retirement age |
| GAO | Government Accountability Office |
| MBR | Master Beneficiary Record |
| RET | retirement earnings test |
| SGA | substantial gainful activity |
| SSA | Social Security Administration |
This working paper provides statistics on working and retired-worker benefit claiming behavior at and around Social Security's early eligibility age (EEA) of 62. It supplements and follows up discussions in Waldron (2013) and Waldron (2015) and presents an introductory framework for Waldron (forthcoming), which will focus on men's working and claiming behavior by lifetime earnings decile. A study that presents statistics for selected population subgroups among the entire fully insured population will miss any variations that may exist within those subgroups. For this reason, the true level of heterogeneity in the underlying fully insured population could be masked by the analytical choices made by the researcher. This paper disaggregates working and claiming behavior into various patterns by sex; and Waldron (forthcoming) will explore whether that behavior differs between and/or within men's lifetime earnings deciles.
Providing statistics on working and claiming requires a series of classification and measurement decisions prior to data tabulation. Accordingly, much of this paper describes the methodology developed to classify and measure the Social Security administrative data that indicate working and claiming behavior. I use classifications that roughly parallel what the Social Security Administration (SSA) describes as the four basic choices for work and retirement—claim benefits and continue working, claim benefits and stop working, do not claim benefits and keep working, and do not claim benefits and stop working.1 For completeness, I include a fifth category that consists of individuals who stopped substantial work prior to claiming benefits (that is, prior to age 62). Although a study of working and claiming behavior at additional Old-Age Insurance (OAI) benefit claiming ages would be of potential interest to policymakers, this analysis is limited to an individual's work status at ages 61 and 63 in conjunction with whether he or she has claimed entitlement to OAI retired-worker benefits at age 62.
This introduction is followed by a section that describes the data and methodology used, followed in turn by two sections that present working and claiming statistics for men and women born during 1937–1944. Supplementary methodological information and tabulations of the data plotted in the paper's charts follow in Appendices A and B, respectively. Disaggregated categories of working and claiming behavior tabulated in this paper are designed to add up to 100% of the fully insured workers who are newly eligible to claim retired-worker benefits at age 62 in a given birth cohort, so that readers may re-aggregate those statistics in analytical combinations that best suit their own research needs.
Previous literature on working and claiming behavior includes Aaron (2013); Bosworth, Burtless, and Zhang (2016); Coile and others (2002); Epstein (1966); Government Accountability Office (GAO) (2014); Pattison (2014); and Sherman (1985). Relative to that literature, this paper—along with the forthcoming work using lifetime earnings deciles—is the most disaggregated in its approach. I defer an extended discussion of this paper's results in the context of that previous literature to the forthcoming companion study, so that this paper can focus on documenting the methodology used to disaggregate the behavior patterns drawn from the Social Security administrative data.
Over the period of retired-worker benefit claiming studied in these papers (1999–2006, when members of the 1937–1944 birth cohorts were first eligible for retired-worker benefits), the Social Security program's full retirement age (FRA) for unreduced retired-worker benefits increased incrementally from 65 (for those born in 1937) to 66 (for those born in 1943 and 1944). As such, the actuarial benefit reduction for claiming at age 62 incrementally increased across those birth cohorts, affecting the 1938 and later cohorts beginning in 2000.
However, labor force participation rates at ages 62–64 had begun to increase in the mid-1990s (Leonesio and others 2012). That increase roughly paralleled a decline in claiming at age 62 observed in the SSA data. Therefore, the downward trend in age-62 claiming observed in the SSA data began before workers affected by the increasing FRA were first eligible to claim. With that said, the scope of this paper's methodological approach does not allow an attempt to disentangle any decreases in age-62 claiming that were potentially driven by the reduction to the monthly benefit amount for such claims over the observation period from any decreases in claiming driven by other potential causes. Examples of such causes include labor market changes, health or mortality improvements, or changes to tastes and preferences for work and leisure that could have occurred independently of the actuarial benefit reduction.
An important caveat to this analysis is that the most recent year of observed earnings, for the youngest birth cohort at age 63, is 2007. The downward trend in age-62 claiming implies that the point estimates in this paper may not necessarily reflect current claiming behavior. I omitted birth cohorts reaching age 63 after 2007 to avoid any effects on working and claiming behavior induced by the severe 2008 recession. For example, to test the strength of the labor market, I used the share of prime-age men working full-time all year as a proxy, and 2019 Current Population Survey tabulations indicate that only in 2018 did that share first return to its 2004 level. Similarly, the average hours worked in the previous week at all jobs in 2019 had been climbing since its trough in 2010, but was still a little below its 2004–2006 level. At this writing, a 2018 extract of my analytical file is not available because of standard data-processing lags.
Data and Methodology
In this section, I discuss the construction of the data set, the definitions of “claiming” and “work,” and the analytical categories that I constructed from those definitions to create the various combinations of working and claiming behavior.
Construction of the Data Set
This analysis uses roughly the same data set as that used in Waldron (2012) and Waldron (2013). That data set was created by a merge of several internal SSA research files, all of which contain individuals selected based on Social Security's research and statistics office's Continuous Work History Sample (CWHS) selection criteria. The 1% CWHS sample “may be described as a stratified cluster probability sample of all possible [Social Security numbers]” (Smith 1989). The CWHS thus contains a longitudinal record of earnings for each Social Security number meeting that 1% selection criteria.
To create the data set, a 2008 active CWHS extract was merged with three other administrative data sources; specifically, a 2010 Master Beneficiary Record (MBR) extract, a 2009 Numerical Identification System (Numident) file extract, and a 2009 Master Earnings File (MEF) extract. The data set contains individuals who were born from 1937 through 1945 and whose records appear on both the active CWHS extract and the Numident extract (N = 272,234). For this study, the CWHS provides annual Old-Age, Survivors, and Disability Insurance (OASDI) taxable earnings data and quarters-of-coverage information from 1951 through 2008. The MEF provides annual earnings reported to the Internal Revenue Service, including earnings in employment not covered by Social Security and earnings in Social Security–covered employment that exceed the OASDI taxable maximum from 1982 through 2008. The MBR is used to identify Social Security disabled-worker beneficiaries and as a source of demographic data; it contains records of individuals who have filed OASDI claims. The Numident is used as a source of demographic data and is the primary source of death data for individuals who do not have an MBR record.
Several restrictions have the effect of biasing the sample towards healthier and longer-lived individuals. First, I exclude any workers who were ever entitled to Disability Insurance (DI) disabled-worker benefits, which removes 42,114 workers from the sample. Next, insured status at age 61 is calculated for the remaining individuals in birth cohorts 1937–1945, and only those who would be fully insured2 at age 62 for retired-worker benefits are included (N = 179,886). Then, the main analytical sample is restricted to workers who lived until at least age 64 (rather than age 63, as in Waldron 2013) to allow all workers an equal chance of working at age 63. The resulting sample of workers who are newly eligible for retired worker benefits at age 62 and are not entitled to disabled-worker benefits is a group of interest to policymakers (see Waldron 2015 for details). From the perspective of the OASDI trust fund, this group of workers can be thought of as roughly the pool of workers most at risk of claiming benefits at age 62.
The sample is restricted to the 1937–1944 birth cohorts, which results in a total sample size of 143,539, of which 74,792 are men and 68,747 are women. Because earnings for the youngest birth cohort (1944) are observed in 2007 (at age 63), possible temporary recession effects on either work or claiming behavior are avoided.
Of the 68,747 female fully insured workers, 6,858 were ever entitled to a widow's benefit at age 61 or younger.3 Another 913 claimed a widow benefit, but did not claim a retired-worker benefit, at age 62. Both of these groups are excluded, for a final sample of 60,976 women. Only 688 men met the equivalent criteria. Because deleting these widowers had no effect on the aggregate estimates, they were retained in the sample.
Fully insured young widows are excluded because on reaching age 62, they may have been dually entitled to both a widow's benefit (payable on the earnings record of their deceased spouse) and a retired-worker benefit (payable on their own earnings record). As discussed in Weaver (2010, 92), if a dually eligible worker chooses to claim both benefits, then that worker will receive his or her worker benefit plus a partial widow benefit. Mathematically, in some cases, the dollar amount of the total benefit payable to a dually entitled widow may be equivalent to the dollar amount of the full widow benefit. In such a case, a widow may choose to claim her full widow benefit, and never formally claim her retired-worker benefit. In other cases, a widow may choose to claim either her widow's benefit or her retired-worker benefit first, and defer the claim of the other (higher) benefit to a later date.4 Accordingly, the subgroup of women who chose to claim a widow's benefit at or before age 62 are excluded to allow a cleaner analytical comparison of working and claiming behavior among the remaining women in the sample. That is, the sample consists of women whose decision to claim a retired-worker benefit at age 62 would be less likely to be affected by eligibility for a survivor's benefit at or before age 62.5
As noted earlier, the sample is restricted to individuals who lived to age 64 so that all workers had an equal chance of claiming at age 63.6
Excluding disabled-worker beneficiaries is an analytical decision that will cause the estimates presented in this paper to differ from estimates in which disabled-worker beneficiaries are included in the denominator or numerator. However, sensitivity testing indicated that the decrease in claiming at age 62 observed in this paper was not counteracted by an accompanying increase in disabled-worker entitlements through age 61 (see Appendix A and Chart A-1). Using a different method to address this question, Pattison (2014, 12) found that “the reduction in exact-age-62 filers cannot be accounted for by a rise in disabled workers at age 62.” Purcell (2016) used yet another method and found a 2 percentage-point increase in the share of fully insured men who were disabled-worker beneficiaries at ages 62–64 and a 16 percentage-point decrease in the proportion who were retired-worker beneficiaries at ages 62–64 over the 1999–2014 period. Thus, it appears safe to conclude that the downward trend in age-62 claiming over time is not explained by a corresponding increase in DI entitlements at that age.
The Definition of Claiming
To examine claiming and working behavior at age 62, I separate the sample into three groups of fully insured workers. The first group claims on reaching age 62 (also designated as “62 and 0–2 months”; specifically, from the 62nd birthday to the day before age 62 and 3 months). The second group claims later at age 62 (that is, from age 62 and 3 months to the day before turning 63; also designated as “62 and 3–11 months”). The third group does not claim at age 62. A plurality of age-62 claimants claim at age 62 and 1 month because a worker must be 62 for an entire calendar month to be entitled to benefits. This entitlement category is lagged 1 month to conservatively allow for noise in the data and for stragglers. I separate the age-62 claimants into two separate categories for both analytical and empirical reasons, described below.
Differences Between Retired-Worker Claims Filed on Reaching Age 62 and Later at Age 62
When the policy community discusses claiming at age 62, it is not always clear whether its focus is on workers filing as soon as possible—that is, either in the month when they turn age 62 or the subsequent month—or on workers who claim benefits any time before they turn age 63.7
Analysts sometimes assume that workers claim benefits as soon as they are eligible at age 62 and simultaneously cease work—that is, that they are induced out of the labor force at age 62 by the option to claim retired-worker benefits—mutually reinforcing reasons that are sometimes deemed to be short-sighted or against the workers' self-interest. Conversely, some analysts assume that other individuals stop work for reasons of health or unemployability prior to age 62 and wait for the first opportunity to claim—a reasoning that is deemed to be rational. In order to control for the possibility that there is selection in the sample along these lines and to test these assumptions, one needs to separate workers whose claiming ages are clustered around their birthday month (or as soon as they first meet the statutory requirements) from other workers claiming at age 62.
Empirically, previous research has indicated that these two groups of age-62 claimants differ in important dimensions. For example, Waldron (2001, 2002) found that men entitled on reaching age 62 had higher mortality risk than those entitled later at age 62, and Waldron (2004) found that they also had poorer health.
In addition, Chart 1 shows that age-62 retired-worker benefit claims for both subgroups have declined over time, but the decline has been steeper for workers claiming on reaching age 62.8 For example, although the percentage of fully insured men claiming on reaching age 62 fell from about 48 percent to 33 percent from the 1931 birth cohort to the 1944 cohort, the percentage of fully insured men claiming later at age 62 fell from about 9 percent to 8 percent across those cohorts.9 Patterns were similar for women.10
Percentages of fully insured workers who claimed on reaching age 62 and later at age 62, by sex and birth cohort
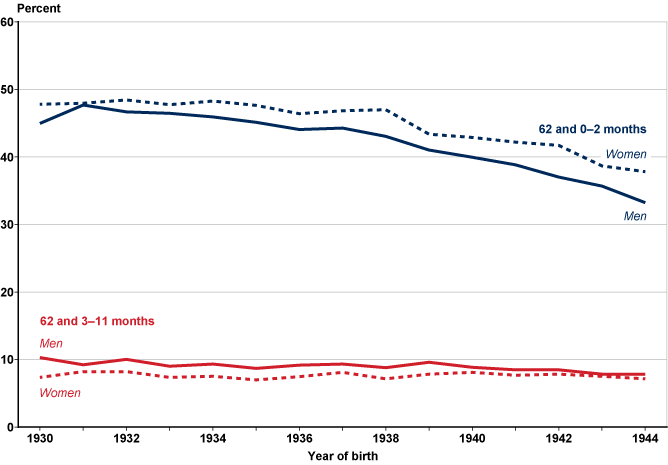
In sum, prudence indicates splitting the sample into two age-62 claim groups and placing the primary analytical interest on the group claiming on reaching age 62. However, because for some purposes readers may prefer a combined age-62 category, I provide enough detail on those claiming later at age 62 that the numbers can be combined, as desired, for an aggregate age-62 statistic.
Two studies using data from SSA's Office of the Chief Actuary found that the rate of claiming at age 62 has continued to decline among newly eligible retired-worker benefit claimants who were born after the most recent cohort observed in this sample. GAO (2014) found that claiming on reaching age 62 dropped from 43% for women born in 1940 to 38% for women born in 1946 and from 38% to 32% for men in those birth cohorts. Purcell (2016), using a somewhat similar method, found that claiming at age 62 among men newly eligible for retired-worker benefits was 33.7% in 2005–2009 and 29.9% in 2010–2014. The rates for women were 38.1% and 33.2%, respectively.11
The Definition of Work
To define “work,” I use the monthly earnings amount designated by SSA as indicating substantial gainful activity (SGA) for a nonblind individual. If a worker applies for Social Security disabled-worker benefits but has earnings at or above the SGA level, the worker is deemed nondisabled and the application is denied.12 I define work as having annual earnings that exceed the nonblind-worker SGA amount multiplied by 12 in the observation year. One possible alternative definition, based on the exempt earnings level used in SSA's retirement earnings test (RET), which affects retired-worker beneficiaries who continue to work before they reach FRA, would be less inclusive.13 For 2007 earnings, for example, the threshold is $12,960 for the RET definition and $10,800 for the SGA definition.14
The question of how to define “work” is complicated, as each definition would likely generate a somewhat different statistic. For example, defining “work” as maintaining an annual wage within x percent of the previous year's annual wage would vary greatly depending on the chosen value of x.
In addition, the age-earner profile is generally hump-shaped, declining after a peak at around age 50. For example, Guvenen and others (2017, 23) used the CWHS and found that “for men, the general shape of the life-cycle profile is similar for all cohorts. Median incomes start low and rise sharply from ages 25 to 45, and then remain roughly constant from ages 45 to 55.” Clingman and Burkhalter (2019), also using the CWHS, found peak earnings at ages 51–52. In this sample, I find the median highest earnings occurring at approximately age 51. Thus, on average, one might expect some post-peak decline in earnings by age for workers—separate from any retirement decision—although one might also expect to find heterogeneity in the shape of age-earner profiles across the Social Security–covered worker population (see, for example, Bosworth, Burtless, and Steuerle 2001; and Bosworth, Burtless, and Zhang 2016, Figure B-7).
On the other end of the spectrum, one could define “work” or labor force participation as any earnings greater than zero observed for an individual in any given year. Because the CWHS includes earnings data for workers with very low earnings amounts in a given year, such a measure would pick up workers who have very limited attachment to the labor force. The SGA measure is one way to screen out these types of workers. Ultimately, any cutoff is arbitrary.
To put the SGA measure in context, it was lower than the nominal full-year full-time earnings of a worker earning the federal minimum wage in almost every year of the observation period. One advantage of the SGA measure is that workers would have to earn below that amount to be eligible for DI benefits, although not all workers insured for retired-worker benefits are also insured for DI benefits at age 61 (Waldron 2013, Tables 3 and 4). Appendix Chart A-2 tests an even lower measure of earnings that roughly follows Burtless, Bosworth, and Zhang (2016) and approximates earnings from full-year part-time employment at the minimum wage. That lower measure had little effect on results. The reason for low sensitivity was that many workers classified as not working at age 61 or age 63 had zero earnings at those ages. For example, for both men and women born in 1944, median earnings for those defined as “not working” were zero at both age 61 and age 63.15
Claiming and Working Categories
One could examine myriad work-and-claiming-decision combinations. Workers can claim, leave the labor force, and then reenter the labor force at any time. When they reenter (limiting the discussion to ages 62–64 for simplicity), their benefits will be reduced by $1 for every $2 in earnings over the RET amount. If a claimant's earnings are high enough, benefits can be suspended or withheld. In either case, the benefit amount will be recalculated each year, adding the new earnings information to the beneficiary's lifetime earnings history.16 In some cases, the benefit amount increases (for example, if a worker replaces a year of zero earnings in the earnings history with a year of full-time earnings). Separate from this benefit recalculation based on new earnings amounts, the monthly retired-worker benefit will be increased permanently, starting at a worker's FRA, to adjust for any months in which benefits were partially or fully withheld because earnings exceeded the RET limit (SSA 2020a).
As a first look at the data, this paper does not include detailed tabulations that would highlight the full menu of work and claiming choices available to the Social Security–covered worker under current law. Such an analysis would have to follow an individual from age 62 until death, tracking all earnings and claiming decisions over that course. Instead, I examine claiming at age 62 and substantial work in the prior and subsequent years (that is, in the years the worker turned 61 and 63). This allows some flexibility in timing and avoids accounting for complicated interactions between a claimant's birth month and month of claim. Because earnings are observed throughout a given year and an individual can attain an age in any month within that given year, the measure of work by age is somewhat approximate. More precision would require monthly earnings observations, which are not available in SSA data.17 The sample is restricted to fully insured workers who lived until age 64 so that all workers have an equal chance of working in the years they attained ages 61 and 63.
Age-62 Claiming Categories
I identify three separate categories of fully insured individuals who claim either on reaching age 62 or later at age 62, described below. The technical definition of the category appears in bold font, followed in italics by the more intuitive phrase sometimes used to refer to the category in this paper's text and charts.
- “Not working at age 61, not working at age 63” or ceased work before claiming. This category contains workers who were not working at or above the adjusted SGA level in the year they turned 61 nor in the year they turned 63. The category is intended to capture workers who ceased work prior to claiming retired-worker benefits. The underlying presumption is that these workers are not timing their work cessation to coincide with their retired-worker benefit claim. However, it is possible that some workers may have ceased work prior to age 62 in anticipation of claiming at age 62. Workers with liquidity constraints who cease work in anticipation of claiming might be induced to work longer if the EEA were raised, assuming they retain the capacity to work.
- “Working at age 61, not working at age 63” or ceased work and claimed around the same time. This category contains covered workers who worked and earned at or above the adjusted SGA level during the year in which they turned 61 and were not working at that level in the year they turned 63. I use this definition to provide an upper bound on the number of workers who could hypothetically time their cessation of substantial work to coincide with their retired-worker benefits claim.
- “Working at age 63” or worked after claiming. I further divide this category into three subgroups based on earnings relative to the RET level: less than 90 percent, from 90 percent to 110 percent, and more than 110 percent.18 As noted earlier, some workers in the third subgroup could have earnings high enough to have their entire benefit withheld or suspended.
The Social Security literature has debated the RET's effect on claiming and work behavior. I identify the three subgroups to allow readers with differing views on the RET's effect on labor force behavior to create their own estimates. However, because the total number of workers clustering at the RET is so small, the forthcoming study analyzing work and claiming behavior by lifetime earnings decile will omit tabulations by these subgroups.
Non-Claiming Categories
I also examine two categories of fully insured workers who do not claim at age 62.
- “Working at age 63” or not claiming, still working. Workers in this category did not claim benefits at age 62 and worked in the year they turned 63 with earnings at or above the adjusted SGA level.
- “Not working at age 63” or not claiming, not working. Workers in this category did not claim benefits at age 62 and did not work and earn at or above the adjusted SGA level at age 63. For some tabulations, I divide this category into two subgroups:
- “Not working at age 61, not working at age 63.” This subgroup captures workers who had no earnings above the adjusted SGA level and were fully insured for retired-worker benefits but who chose not to claim them.
- “Working at age 61, not working at age 63.” This subgroup differs from the other in that these workers have more recently disengaged from SGA.
Results for Fully Insured Workers Who Claimed at Age 62
Both subgroups of age 62 claimers were distributed between multiple categories of working and claiming. Different patterns of claiming behavior were also observed between the two age-62 subgroups.
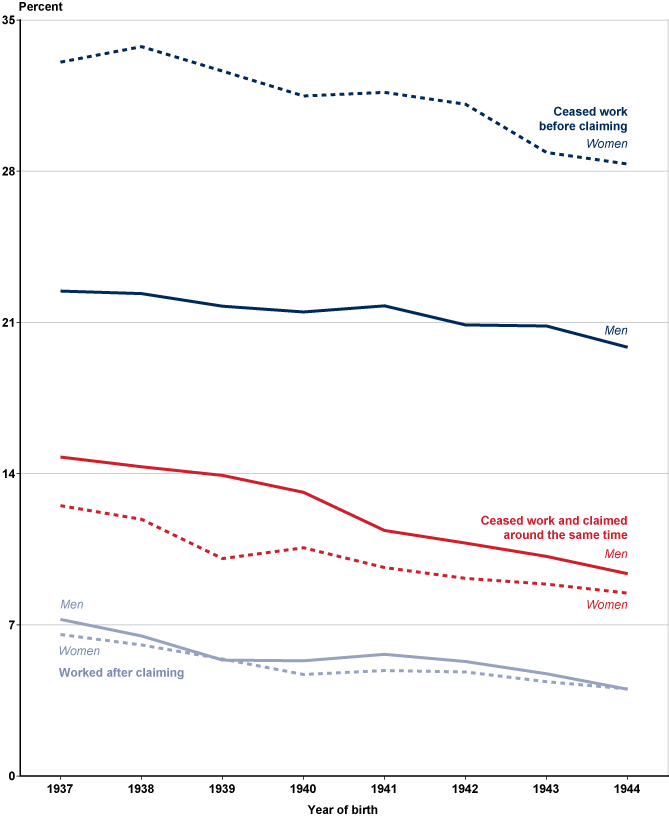
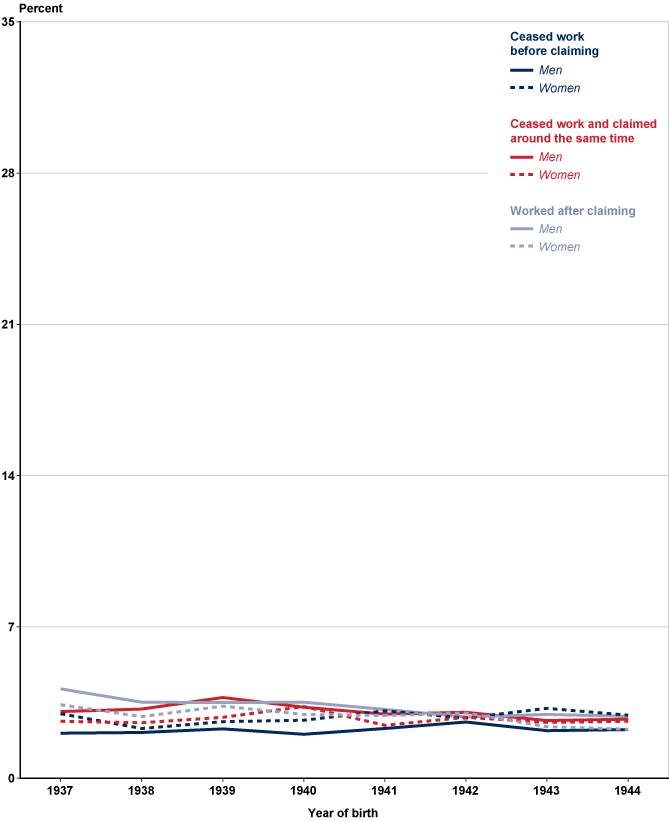
Chart 2 shows the differences between the claiming- and working-status combinations among workers claiming on reaching age 62, by sex, and Chart 3 does the same for workers claiming later at age 62.19 Table 1 displays results for both subgroups of age-62 claimants in the oldest (1937) and youngest (1944) birth cohorts observed in the sample. Taken together, the charts (and Table 1) also highlight the differences between the two age-62 subgroups (0–2 months and 3–11 months).
Percentages of fully insured workers who claimed at age 62 and 0 through 2 months, by work status, sex, and birth cohort
Percentages of fully insured workers who claimed at age 62 and 3 through 11 months, by work status, sex, and birth cohort
| Work status | Claiming age 62 and 0–2 months | Claiming age 62 and 3–11 months | ||||
|---|---|---|---|---|---|---|
| 1937 | 1944 | Trend | 1937 | 1944 | Trend | |
| Men | ||||||
| All claimants | 44.5 | 33.2 | a | 9.3 | 7.9 | a |
| Not working at age 63 and— | ||||||
| Did not work at age 61 | 22.5 | 19.9 | Downward* | 2.1 | 2.3 | Not significant |
| Worked at age 61 | 14.8 | 9.4 | Downward* | 3.1 | 2.7 | Downward* |
| Working at age 63 and— | 7.3 | 4.0 | Downward* | 4.1 | 2.9 | Downward* |
| Earning <90% RET level | 0.8 | 0.6 | Downward** | 0.3 | 0.2 | Not significant |
| Earning 90%–110% RET level | 3.1 | 1.6 | Downward* | 0.9 | 0.7 | Not significant |
| Earning >110% RET level | 3.4 | 1.8 | Downward* | 2.9 | 2.0 | Downward* |
| Women | ||||||
| All claimants | 52.1 | 40.9 | a | 9.0 | 7.8 | a |
| Not working at age 63 and— | ||||||
| Did not work at age 61 | 33.1 | 28.3 | Downward* | 3.0 | 2.9 | Not significant |
| Worked at age 61 | 12.5 | 8.5 | Downward* | 2.6 | 2.6 | Not significant |
| Working at age 63 and— | 6.6 | 4.0 | Downward* | 3.4 | 2.3 | Downward* |
| Earning <90% RET level | 0.9 | 0.7 | Not significant | 0.3 | 0.1 | Not significant |
| Earning 90%–110% RET level | 3.0 | 1.7 | Downward* | 0.7 | 0.7 | Not significant |
| Earning >110% RET level | 2.7 | 1.6 | Downward* | 2.4 | 1.5 | Downward* |
| SOURCE: Author's calculations using a merged 1% CWHS, MBR, and Numident file. | ||||||
| NOTES: Sample is restricted to fully insured workers who lived to age 64 and excludes disabled-worker beneficiaries and young female widow beneficiaries.
* = statistically significant at the 10 percent level; ** = statistically significant at the 1 percent level; where working and claiming subgroup (y) = year of birth + the unemployment rate at age 62.
|
||||||
| a. Statistical significance of trend not tested. | ||||||
As noted earlier, the share of workers claiming on reaching age 62 declined between the 1937 and 1944 birth cohorts. Chart 2 and Table 1 show that all three work-and-claiming-behavior subgroups among men and women alike have experienced statistically significant20 declines over time.
Among fully insured men, the steepest decline in claiming on reaching age 62 has been for those who ceased work and claimed at around the same time—their share fell from 14.8 percent to 9.4 percent. For fully insured women in that category, the share who claimed on reaching age 62 was smaller and dropped a little less steeply than the men's shares, declining from 12.5 percent to 8.5 percent across birth years 1937–1944.
The declines for this work and claiming subgroup cannot be explained by SSA's elimination of break-even analysis at field offices because the declines occurred before those analyses were eliminated.21 Additionally, the EEA remained 62 over the observation period, suggesting that at least some of these workers were capable of curbing this behavior in the absence of a statutory increase in the EEA. In other words, whatever work disincentives could have been attributed to the option to claim benefits at age 62 appear to have been overpowered by other factors in at least some workers' utility functions when those workers optimized their claiming decisions, subject to a budget constraint, over birth cohorts 1937–1944.
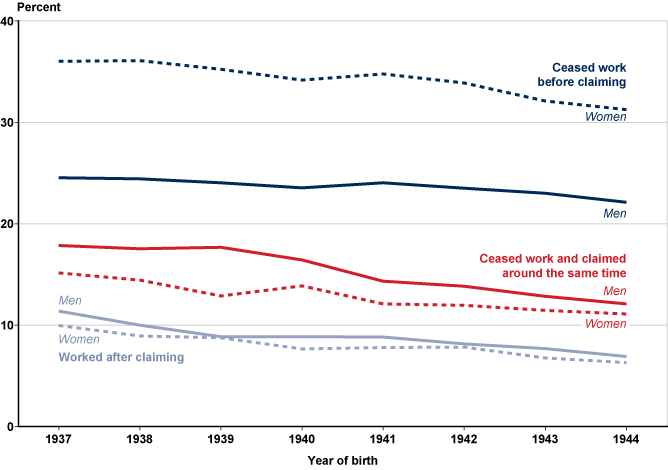
Across the 1937–1944 birth cohorts, more age-62 claimants had ceased work by the year they turned 61, or prior to claiming, than at any other time (Chart 4).22 For the 1944 cohort, for example, the shares of fully insured workers exhibiting this behavior were about 22 percent for men (19.9 percent claiming on reaching age 62 and 2.3 percent claiming later at age 62; Table 1) and 31 percent for women (28.3 percent claiming on reaching age 62 and 2.9 percent claiming later at age 62; Table 1). The share of women in this category exceeded that of men by about 11 percentage points at the beginning and 9 percentage points at the end of the observation period, indicating a somewhat larger decline for women than for men. The share of fully insured workers who worked after claiming on reaching age 62 also declined across cohorts, from 7.3 percent to 4.0 percent for men and from 6.6 percent to 4.0 percent for women (Chart 2 and Table 1).
Percentages of fully insured workers who claimed at any point at age 62, by work status, sex, and birth cohort
As noted earlier, I analyze three earnings-level subgroups of individuals who worked after claiming: less than 90% of the RET (but above the SGA level), 90%–110% of the RET, and more than 110% of the RET. The proportions of workers in all three categories declined across cohorts, although the decline for women earning less than the RET is very slight and is not statistically significant. None of the three earnings-level categories dominated the other two. For example, among men born in 1944, 0.6 percent had earnings below the RET amount, 1.6 percent had earnings at the RET, and 1.8 percent had earnings above the RET.
For the smaller group of workers who claimed later at age 62, similar proportions fell into each working and claiming category, with around 2% to 3% for both men and women (Chart 3 and Table 1). In terms of the small decline in claiming over the birth cohorts examined for this group, the largest (about 1 percentage point) occurred for men and women who worked after they claimed.
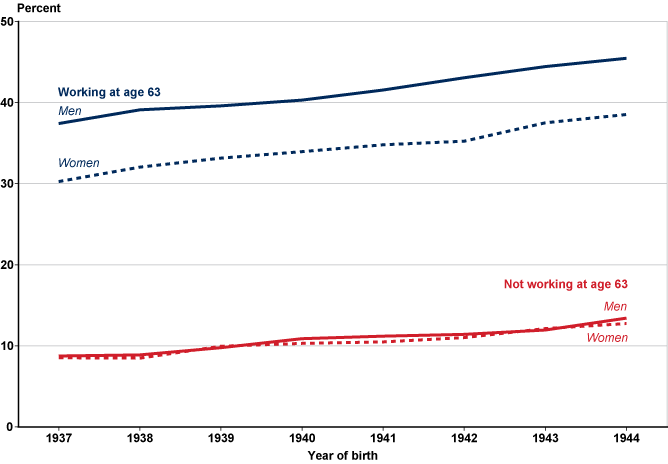
Results for Fully Insured Workers Who Did Not Claim at Age 62
The share of fully insured men who did not claim at age 62 and who were working at age 63 increased by 8 percentage points from the 1937 birth cohort to the 1944 cohort (Chart 5),23 and this upward trend was statistically significant. If one counts all fully insured men—including those who claimed benefits at age 62 and worked after claiming—52.3 percent of those in the 1944 birth cohort were working at age 63 (Table 2).
Percentages of fully insured workers not claiming at age 62, by work status at age 63, sex, and birth cohort
| Work and claiming pattern | Born in— | Trend | |
|---|---|---|---|
| 1937 | 1944 | ||
| Men | |||
| Working at age 63 | 48.8 | 52.3 | a |
| Did not claim at age 62 | 37.4 | 45.5 | Upward* |
| Claimed at age 62 | 11.4 | 6.8 | Downward* |
| Not working at age 63 and did not claim at age 62 | 8.8 | 13.4 | a |
| Did not work at age 61 | 6.5 | 10.2 | Upward* |
| Worked at age 61 | 2.3 | 3.2 | Upward* |
| Women | |||
| Working at age 63 | 40.3 | 44.9 | a |
| Did not claim at age 62 | 30.3 | 38.5 | Upward* |
| Claimed at age 62 | 10.0 | 6.4 | Downward* |
| Not working at age 63 and did not claim at age 62 | 8.5 | 12.8 | a |
| Did not work at age 61 | 6.8 | 10.4 | Upward* |
| Worked at age 61 | 1.7 | 2.4 | Upward* |
| SOURCE: Author's calculations using a merged 1% CWHS, MBR, and Numident file. | |||
| NOTES: Sample is restricted to fully insured workers who lived to age 64 and excludes disabled-worker beneficiaries and young female widow beneficiaries.
* = statistically significant at the 10 percent level, where working and claiming subgroup (y) = year of birth + the unemployment rate at age 62.
|
|||
| a. Statistical significance of trend not tested. | |||
Between the 1937 and 1944 cohorts, the share of women working at age 63 who had not claimed at age 62 increased by almost the same percentage points as did the share of men. However, because the 1937 female birth cohort started out with a lower level of workers in this category, the proportion of fully insured women born in 1944 who were working at age 63 was only 44.9 percent.
For the other group of workers—those who neither worked at 63 nor claimed at 62—the proportion increased across cohorts by 4.6 percentage points for men. Within that group, the largest subgroup of workers, and the subgroup with the largest increase over time, had stopped working by age 61 (at 10.2 percent of fully insured men born in 1944). A smaller proportion (3.2 percent of those born in 1944) had worked at age 61 but were not working at age 63. All these upward trends across cohorts in the group neither working nor claiming were statistically significant. Results were almost identical for women.
Overall, the share of workers claiming at age 62 (Table 1) has declined more than the share of workers working at age 63 has increased (Table 2). This result appears to be explained by the fact that the share of workers in the not claiming at 62, not working at 63 category increased over the same period in which the share claiming at age 62 decreased.
One statistical concern about the estimates for the not claiming at 62, not working at 63 category is that some of these workers may have died—with their deaths unrecorded in the SSA data. Although the completeness of death reporting for Social Security beneficiaries is thought to be close to 100 percent, the accuracy of death reports for nonbeneficiaries is somewhat unknown (Aziz and Buckler 1992). Because these workers have not yet claimed, it is plausible that some observations represent unrecorded deaths. Therefore, this paper's Appendix A and Waldron (forthcoming) contain several sensitivity tests for this group of workers. In aggregate, the proportion of workers in the not claiming at 62, not working at 63 category was reduced by around 2 percentage points for birth cohorts 1937 and 1938 when the sample was restricted to workers who had either claimed retired-worker benefits or died by age 70.24 Overall, one can conclude that although the estimates for this group of workers may have some noise, the phenomenon exists in which a worker ceases to engage in SGA but does not take the first available opportunity to claim benefits to which he or she is entitled.25
One could hypothesize that the EEA of 62 is relatively less likely to influence the work behavior of three categories of workers:
- those who ceased working before reaching age 62,
- those working at age 63, and
- those not working at age 63 who did not claim benefits at age 62.
For fully insured workers of the 1944 birth cohort, 88% of men and 89% of women belonged to one of those categories. Those shares were 6 percentage points higher for men and 4 percentage points higher for women than the shares of their counterparts in the 1937 birth cohort. The shares of fully insured men and women belonging to one of these categories were also substantially higher over the observation period than the percentages of men and women claiming at age 62, which fell from 54% to 41% for men and from 61% to 49% for women across the 1937 and 1944 birth cohorts.
Conclusion
This paper has observed work behavior at ages 61 and 63 and claiming behavior at Social Security's EEA of 62—that is, when workers are first eligible to claim Social Security retired-worker benefits. These observations were limited to workers born from 1937–1944 (aged 61–63 in 1998–2007) and conditional on workers living to age 64, never having been DI disabled-worker beneficiaries, and being fully insured (eligible) at age 62 to claim retired-worker benefits. Women claiming survivors' benefits at or prior to age 62 were also excluded from the sample.
For both sexes, this study found that fully insured workers were distributed across multiple working- and claiming-status combinations, rather than being concentrated in one particular working- and claiming-status category. Across the 1937–1944 birth cohorts, the shares of fully insured workers who claimed benefits and stopped working at around the same time, who claimed benefits and continued working, and who stopped working before claiming benefits all declined significantly. Conversely, the shares of fully insured workers who did not claim benefits and continued working, and who did not claim benefits and did cease working, both increased significantly over time.
Overall, the share of workers claiming at age 62 has declined more than the share of workers continuing work at age 63 has increased. This result appears to reflect the increase in the share of workers in the not claiming at 62, not working at 63 category over the observation period, during which the share who claimed at age 62 decreased.
Across these birth cohorts, the largest shares of age-62 claimants—comprising 22.2 percent of male and 31.2 percent of female fully insured workers by the end of the observation period—had ceased work by age 61. Only a minority of fully insured workers had ceased work and claimed benefits at around the same time at age 62, and that share declined more than the shares for the other two age-62 claiming categories for men across the 1937–1944 birth cohorts. By the 1944 birth cohort, the proportion of fully insured workers who ceased work and claimed at around the same time had fallen to 12.1 percent for men and 11.1 percent for women.
The 1961 Amendments to the Social Security Act established age 62 as the EEA for Social Security retired-worker benefits for men.26 Wilber Cohen, the Assistant Secretary of Legislation for the Department of Health, Education, and Welfare, and Social Security Commissioner William Mitchell summarized the amendments that year. They appear to have expected men to self-sort or self-select into categories or claiming ages that best met their circumstances:
Under the provision making reduced benefits available at age 62, a man can weigh the amount of the benefit he can get against his physical condition, the availability of work, and his general financial situation and make the choice that seems best for him under all the circumstances (Cohen and Mitchell 1961, 14).
SSA's information sheet “When to Start Receiving Retirement Benefits” echoes that statement today:
At Social Security, we're often asked, “What's the best age to start receiving retirement benefits?” The answer is that there's not a single “best age” for everyone and, ultimately, it's your choice. The most important thing is to make an informed decision. Base your decision about when to apply for benefits on your individual and family circumstances (SSA 2020b).
Overall, the SSA data reveal a heterogeneity in working and claiming behavior at age 62, which suggests that workers may be self-selecting or self-sorting into working and claiming categories according to individual and/or family circumstances, as suggested by Cohen and Mitchell (1961) and SSA (2020b). Waldron (forthcoming) will explore whether heterogeneity in working and claiming behavior for all workers masks a homogeneity in working and claiming behavior among workers within earnings deciles. That study will also measure the relative mortality risk of various combinations of working and claiming statuses at age 62, to explore whether this self-sorting follows correlations between labor force participation, health, benefit claiming, and mortality risk that have been observed in the literature.
Appendix A: Supplementary Methodological Information
Alternative Ways to Test the Effect of DI-Benefit Claiming on Age-62 Retirement-Benefit Claiming Trends
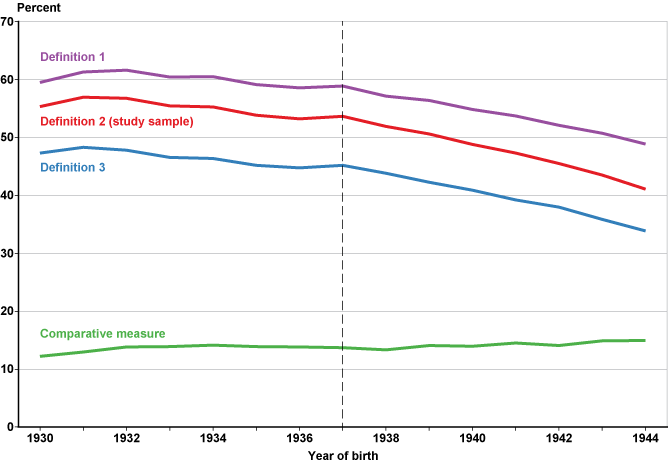
Chart A-1 compares four methods of measuring trends in retired-worker benefit claiming at age 62 for men born from 1930 through 1944 (aged 62 in 1992–2006). The methods involve alternative definitions of the numerator and the denominator in calculations of the shares of eligible claimants who claim at age 62. The analytic method used in this paper (shown as definition 2 in Chart A-1) excludes DI disabled-worker beneficiaries from the sample, calculates the number of workers newly entitled to retired-worker benefits at age 62, and divides that number by the number of workers who were fully insured at age 61.
Percentages of male workers who were fully insured at age 61 and claimed at age 62 under alternative sample definitions, by birth cohort
| Year of birth | Comparative measure | Definition 1 | Definition 2 | Definition 3 |
|---|---|---|---|---|
| 1930 | 12.19 | 59.49 | 55.31 | 47.29 |
| 1931 | 12.98 | 61.27 | 56.95 | 48.29 |
| 1932 | 13.84 | 61.64 | 56.74 | 47.79 |
| 1933 | 13.88 | 60.41 | 55.47 | 46.53 |
| 1934 | 14.12 | 60.48 | 55.28 | 46.36 |
| 1935 | 13.91 | 59.11 | 53.81 | 45.20 |
| 1936 | 13.85 | 58.59 | 53.21 | 44.75 |
| 1937 | 13.70 | 58.89 | 53.67 | 45.19 |
| 1938 | 13.32 | 57.13 | 51.88 | 43.81 |
| 1939 | 14.07 | 56.36 | 50.63 | 42.29 |
| 1940 | 13.93 | 54.82 | 48.82 | 40.89 |
| 1941 | 14.49 | 53.70 | 47.32 | 39.20 |
| 1942 | 14.09 | 52.07 | 45.50 | 37.99 |
| 1943 | 14.86 | 50.74 | 43.52 | 35.88 |
| 1944 | 14.97 | 48.86 | 41.07 | 33.89 |
An alternative method (shown as definition 3) more closely approximates the statutory definition of fully insured status. It divides the number of workers newly entitled to retired-worker benefits at age 62 by the number of workers who were fully insured at age 61, including DI disabled-worker beneficiaries (who must be fully insured in the quarter in which they become disabled to qualify). This method results in a lower percentage of workers claiming benefits at age 62 for each birth cohort (because the denominator is greater), but it does not affect the downward trend in age-62 claiming.
A third method (definition 1) includes workers entitled to DI disabled-worker benefits through age 61 in the numerator as well as the denominator. This method tests whether the downward trend in age-62 retired-worker benefit claims has been counteracted by a rise in disabled-worker awards prior to age 62. If workers in later birth cohorts increasingly seek and receive disabled-worker benefits before age 62 in lieu of claiming retired-worker benefits at age 62, we would expect their inclusion in the numerator to blunt the downward trend of age-62 claiming. Chart A-1 shows that including disabled-worker beneficiaries in the numerator has no discernable effect on the downward pattern of age-62 retired-worker claiming.
For comparative purposes, the bottom line on the chart plots a measure that includes workers entitled to DI disabled-worker benefits through age 61 in the numerator and the number of workers who were fully insured at age 61, including DI disabled-worker beneficiaries, in the denominator.
Alternative Definitions of Work
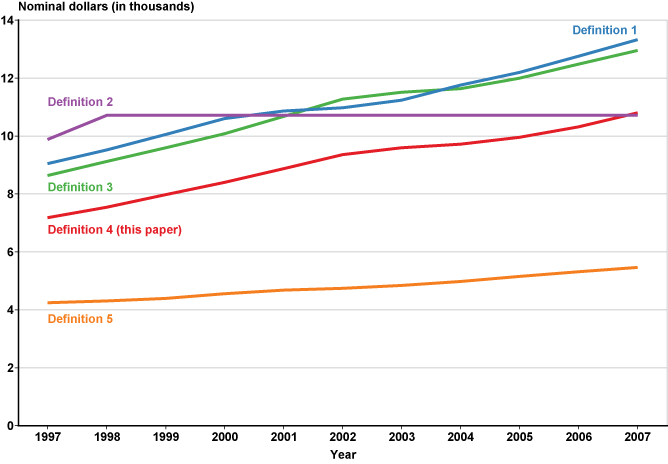
For this paper, I consider a person to be working in a given year if his or her earnings exceed 12 times the monthly SGA level for that year. In the papers most similar to this one, Pattison (2014) defined positive earnings as anything greater than 33% of the national AWI (which was very close to Social Security's pre-FRA RET amount) and Bosworth, Burtless, and Zhang (2016) defined earnings as an amount greater than the 2005 minimum wage, adjusted using the Consumer Price Index, multiplied by 1,000 hours. Chart A-2 compares those three definitions, as well as the “lower” pre-FRA RET amount (for years preceding the calendar year of FRA), and the nominal federal minimum wage times 40 (hours) times 52 (weeks), for 1997–2007.
Alternative definitions of “work”: Earnings thresholds indicating work status, 1997–2007
| Year | Definition 1 | Definition 2 | Definition 3 | Definition 4 | Definition 5 |
|---|---|---|---|---|---|
| 1997 | 9.051 | 8.640 | 9.880 | 7.188 | 4.249 |
| 1998 | 9.524 | 9.120 | 10.712 | 7.548 | 4.305 |
| 1999 | 10.055 | 9.600 | 10.712 | 7.980 | 4.402 |
| 2000 | 10.611 | 10.080 | 10.712 | 8.400 | 4.554 |
| 2001 | 10.864 | 10.680 | 10.712 | 8.880 | 4.679 |
| 2002 | 10.973 | 11.280 | 10.712 | 9.360 | 4.743 |
| 2003 | 11.241 | 11.520 | 10.712 | 9.600 | 4.849 |
| 2004 | 11.764 | 11.640 | 10.712 | 9.720 | 4.975 |
| 2005 | 12.194 | 12.000 | 10.712 | 9.960 | 5.150 |
| 2006 | 12.755 | 12.480 | 10.712 | 10.320 | 5.316 |
| 2007 | 13.334 | 12.960 | 10.712 | 10.800 | 5.468 |
Despite different definitions of work, Pattison (2014) and Bosworth, Burtless, and Zhang (2016) found patterns of behavior that were roughly similar to this paper's aggregate results (where the results are comparable). However, because the nominal minimum wage was flat for most of the period, while the SGA—the basis for this paper's measure of work—is indexed to the national average wage, the SGA measure was lower than the minimum wage in 1997, but rose steadily thereafter, until surpassing it slightly in 2007.
For the analysis by lifetime earnings decile in Waldron (forthcoming), this means that some of the work patterns of workers in lower deciles could be an artifact of the flat minimum wage—that is, as the SGA level rises relative to the minimum wage, the methodology may define fewer people as working year by year. Potentially, these workers might still participate in the labor force with a substantial number of hours per week, but at a lower level (because the real minimum wage has declined over time). Accordingly, I performed some sensitivity tests for an alternative work definition adapted from that of Bosworth, Burtless, and Zhang (2016). Their definition (shown as definition 5 in Chart A-2) approximates the earnings of workers who worked all year, part-time (1,000 hours) at the minimum wage.27 Overall, the alternative definition made little difference to the work-behavior results. In addition, there was almost no effect on the direction of trends by decile when those trends were reestimated under this alternative definition of work, as Waldron (forthcoming) will discuss.
Sensitivity to Possible Missing Death Reports
Although reporting of the death of Social Security beneficiaries is thought to be close to 100 percent, the accuracy of death reports for nonbeneficiaries is somewhat unknown (Aziz and Buckler 1992). For this analysis, one would expect any unobservable or missing deaths to affect workers in the “did not claim at age 62” (that is, nonbeneficiary) category. Therefore, to conduct a rough sensitivity check, I recalculated the estimates for this category after restricting the analytical sample to workers who had either died or claimed by age 70. Because nearly all workers claim by age 70, some observed workers who have not claimed by that age may have died (but their record lacks a death report). Given that conducting this test requires waiting until the subject reaches age 70 (to allow most workers a chance to claim), one can measure sensitivity only for workers born in 1937 and 1938 (the other workers in the sample are too young).
For the full sample of workers, applying the restriction described above has a small effect on the estimates. However, there is greater sensitivity to results for first and second deciles, as will be discussed in Waldron (forthcoming). Sensitivity is specifically limited to the measure of the proportion of workers in the “did not claim at age 62 and not working at age 63” category. The proportion of workers in the “working at age 63 and did not claim at age 62” category were not affected by the sample restriction, which makes sense because to have earnings at age 63, a worker would have to be alive at that age.
Overall, the proportion of workers in the “not working at age 63 and did not claim at age 62” category was reduced by around 2 percentage points for both the 1937 and 1938 birth cohorts under this test.
I also tested the sensitivity of the estimates to the omission of foreign-born workers from the sample. That omission had no effect on the estimates.
Appendix B: Corresponding Tabulations for Charts 1–5
| Year of birth | Claiming age 62 and 0–2 months | Claiming age 62 and 3–11 months | ||
|---|---|---|---|---|
| Men | Women | Men | Women | |
| 1930 | 45.0 | 47.8 | 10.3 | 7.4 |
| 1931 | 47.7 | 48.0 | 9.3 | 8.2 |
| 1932 | 46.7 | 48.4 | 10.0 | 8.2 |
| 1933 | 46.5 | 47.8 | 9.0 | 7.4 |
| 1934 | 45.9 | 48.3 | 9.3 | 7.5 |
| 1935 | 45.1 | 47.6 | 8.7 | 7.0 |
| 1936 | 44.0 | 46.4 | 9.2 | 7.5 |
| 1937 | 44.3 | 46.8 | 9.4 | 8.1 |
| 1938 | 43.1 | 47.0 | 8.8 | 7.1 |
| 1939 | 41.0 | 43.4 | 9.6 | 7.9 |
| 1940 | 40.0 | 42.9 | 8.9 | 8.1 |
| 1941 | 38.8 | 42.2 | 8.5 | 7.7 |
| 1942 | 37.0 | 41.7 | 8.5 | 7.9 |
| 1943 | 35.7 | 38.7 | 7.8 | 7.5 |
| 1944 | 33.2 | 37.8 | 7.8 | 7.2 |
| SOURCE: Author's calculations using a merged 1% CWHS, MBR, and Numident file. | ||||
| NOTE: Sample is restricted to fully insured workers who lived to age 64 and excludes disabled-worker beneficiaries. | ||||
| Year of birth | Claiming age 62 and 0–2 months (Chart 2) | Claiming age 62 and 3–11 months (Chart 3) | ||||
|---|---|---|---|---|---|---|
| Ceased work before claiming | Ceased work and claimed around the same time | Worked after claiming | Ceased work before claiming | Ceased work and claimed around the same time | Worked after claiming | |
| Men | ||||||
| 1937 | 22.5 | 14.8 | 7.3 | 2.1 | 3.1 | 4.1 |
| 1938 | 22.3 | 14.3 | 6.5 | 2.1 | 3.2 | 3.5 |
| 1939 | 21.8 | 13.9 | 5.4 | 2.3 | 3.7 | 3.5 |
| 1940 | 21.5 | 13.1 | 5.3 | 2.0 | 3.3 | 3.5 |
| 1941 | 21.8 | 11.4 | 5.6 | 2.3 | 3.0 | 3.2 |
| 1942 | 20.9 | 10.8 | 5.3 | 2.6 | 3.0 | 2.8 |
| 1943 | 20.8 | 10.2 | 4.7 | 2.2 | 2.7 | 3.0 |
| 1944 | 19.9 | 9.4 | 4.0 | 2.3 | 2.7 | 2.9 |
| Women | ||||||
| 1937 | 33.1 | 12.5 | 6.6 | 3.0 | 2.6 | 3.4 |
| 1938 | 33.8 | 11.9 | 6.1 | 2.3 | 2.6 | 2.9 |
| 1939 | 32.6 | 10.1 | 5.4 | 2.6 | 2.8 | 3.3 |
| 1940 | 31.5 | 10.6 | 4.7 | 2.7 | 3.3 | 3.0 |
| 1941 | 31.7 | 9.7 | 4.9 | 3.1 | 2.5 | 2.9 |
| 1942 | 31.1 | 9.2 | 4.8 | 2.8 | 2.8 | 3.0 |
| 1943 | 28.9 | 8.9 | 4.4 | 3.2 | 2.6 | 2.4 |
| 1944 | 28.3 | 8.5 | 4.0 | 2.9 | 2.6 | 2.3 |
| SOURCE: Author's calculations using a merged 1% CWHS, MBR, and Numident file. | ||||||
| NOTE: Sample is restricted to fully insured workers who lived to age 64 and excludes disabled-worker beneficiaries and young female widow beneficiaries. | ||||||
| Year of birth | Men | Women | ||||
|---|---|---|---|---|---|---|
| Ceased work before claiming | Ceased work and claimed around the same time | Worked after claiming | Ceased work before claiming | Ceased work and claimed around the same time | Worked after claiming | |
| 1937 | 24.5 | 17.9 | 11.4 | 36.0 | 15.2 | 10.0 |
| 1938 | 24.5 | 17.5 | 10.0 | 36.1 | 14.5 | 8.9 |
| 1939 | 24.0 | 17.7 | 8.9 | 35.2 | 12.9 | 8.7 |
| 1940 | 23.5 | 16.4 | 8.9 | 34.2 | 13.9 | 7.7 |
| 1941 | 24.1 | 14.3 | 8.8 | 34.8 | 12.1 | 7.8 |
| 1942 | 23.5 | 13.8 | 8.1 | 33.9 | 12.0 | 7.8 |
| 1943 | 23.0 | 12.8 | 7.7 | 32.1 | 11.5 | 6.8 |
| 1944 | 22.1 | 12.1 | 6.9 | 31.3 | 11.1 | 6.3 |
| SOURCE: Author's calculations using a merged 1% CWHS, MBR, and Numident file. | ||||||
| NOTE: Sample is restricted to fully insured workers who lived to age 64 and excludes disabled-worker beneficiaries and young female widow beneficiaries. | ||||||
| Year of birth | Working at age 63 | Not working at age 63 | ||
|---|---|---|---|---|
| Men | Women | Men | Women | |
| 1937 | 37.4 | 30.3 | 8.8 | 8.5 |
| 1938 | 39.1 | 32.0 | 8.9 | 8.5 |
| 1939 | 39.6 | 33.2 | 9.8 | 9.9 |
| 1940 | 40.3 | 34.0 | 10.9 | 10.3 |
| 1941 | 41.6 | 34.8 | 11.2 | 10.5 |
| 1942 | 43.1 | 35.2 | 11.4 | 11.1 |
| 1943 | 44.5 | 37.5 | 12.0 | 12.1 |
| 1944 | 45.5 | 38.5 | 13.4 | 12.8 |
| SOURCE: Author's calculations using a merged 1% CWHS, MBR, and Numident file. | ||||
| NOTE: Sample is restricted to fully insured workers who lived to age 64 and excludes disabled-worker beneficiaries and young female widow beneficiaries. | ||||
Notes
1 For details, see https://www.ssa.gov/benefits/retirement/matrix.html.
2 For these birth cohorts, fully insured status was defined as having at least 40 quarters of coverage, or 10 years of work, in Social Security–covered employment.
3 Technically, some workers may have claimed widow's benefits at a young age and then remarried—which could then eliminate their eligibility for a widow's benefit at age 62. For this analysis, I ignored this complication.
4 See https://www.ssa.gov/planners/survivors/ifyou.html and Shuart, Weaver, and Whitman (2010).
5 From administrative data on Old-Age and Survivors Insurance, we would know only that a worker is married or widowed if he or she submits a claim for a spouse or survivor benefit. This means that widows who were eligible for survivor's benefits but who had not yet claimed those benefits would remain in the analytical sample. The woman's claiming decision should therefore not be viewed as analytically equivalent to the man's decision, because the risk pool is expected to be cleaner for men. One could also think about a couple's claiming risk pool in which insured status for both survivors and retired-worker benefits was used for analysis. How that broader risk pool would affect analytical results is unknown.
6 This restriction eliminates workers who died at ages 62 and 63, a group that may be expected to be affected by proposed increases in the EEA. Of men born from 1937 through 1944 who were not disabled-worker beneficiaries, were fully insured, and were alive at age 61, 1,329 (2%) died at age 62 or 63. Of those 1,329 men, 51% never claimed retired-worker benefits, 47% claimed them at age 62, and 2% claimed them at age 63. Of those who claimed at age 62, 33% were working at age 61 and 24% were working at age 62. Of those who did not claim benefits at age 62, 53% were working at age 61 and 40% were working at age 62.
7 The policy community also sometimes refers to “early claimants,” which can refer to workers who claim retired-worker benefits at any age between 62 and their FRA. Workers in this broader group differ from each other on many important dimensions. See Waldron (2015, 11–12) for an extended discussion.
8 Appendix Table B-1 presents the underlying data.
9 Pattison (2014, Figure 10) found that among men born from 1909 to 1944, retired-worker benefit claims at age 62 rose to a peak in 1993 (the 1931 birth cohort), then declined for subsequent cohorts.
10 In Chart 1, female claimants include young widows.
11 In measuring claiming trends by birth cohort and sex (which controls for changes in the age-sex composition of the fully insured population over time), this paper uses the same general concept as those of GAO (2014) and Purcell (2016). However, because this paper's tabulations are based on a microlevel data set, there may be some technical differences in data and methodology. Nevertheless, for birth year 1940, my estimates are very close to those of GAO (2014) in the percentage claiming on reaching age 62. Because of the size of the baby boomer cohorts, the method that should be avoided when analyzing trends in claiming over time is to use the cross-sectional data from Table 6.B5 of the Annual Statistical Supplement to the Social Security Bulletin to produce claiming statistics. See Munnell and Chen (2015) and Muldoon and Kopcke (2008) for details.
12 Since 2000, the SGA formula has generally changed with changes in the national average wage index (AWI). I have adjusted SGA amounts for years before 2000 to reflect the values that would have been calculated with the AWI. These adjustments affect only the 1937 and 1938 birth cohorts (aged 61 in 1998 and 1999, respectively). See https://www.ssa.gov/OACT/COLA/sga.html for details.
13 The RET, which is generally indexed to the national AWI, has two exempt-earnings tiers: a higher one for workers in the months of the calendar year in which they reach FRA and a lower one for younger beneficiaries. In this paper, all references to an earnings threshold based on the RET signify the lower, pre-FRA tier. See https://www.ssa.gov/oact/COLA/rtdet.html for details.
14 Appendix Chart A-2 compares earnings thresholds for five alternative definitions of work.
15 For men and women born in 1944 and defined as “not working,” 75th-percentile earnings were respectively only 21% and 25% of the SGA measure at age 61 and 14% and 13% of the SGA measure at age 63. Earnings did not come close to the SGA measure until the 99th percentile of the earnings distributions.
16 See https://www.ssa.gov/planners/retire/whileworking.html for details.
17 Pattison (2014, 7) discusses timing issues in detail. He notes that SSA records earnings data annually so that “earnings in the year a person turned 62, might have been earned almost entirely while 61. The later in the year a person's birthday is, the more likely it is that earnings might not have occurred on or after the month of the birthday.” Although Pattison assigns the earnings to months of age, this paper takes the approach of using the observable annual earnings but tabulating the number of workers in the year in which the worker was either age 61 or age 63. For example, a worker whose birthday occurred in either the first or the last month of the age-62 year would be observed as working at age 63 as long as he or she earned more than the annual nonblind SGA amount sometime in the age-63 year. For that reason, not all workers necessarily worked the same number of months at age 63 in a given year.
18 Recall that I define working as having earnings at or above the nonblind SGA amount, so a worker with earnings less than the RET level, but equal to or greater than the SGA level, is counted.
19 Appendix Table B-2 shows the data underlying Charts 2 and 3.
20 To test the significance of the trends, I ran logit regressions for each working and claiming category in which y = the working- and claiming-age category and x = year of birth + the unemployment rate that was measured at age 62 by the Bureau of Labor Statistics for that year of birth. A trend is reported as significant if the year-of-birth variable is significant. This simple test forces year of birth to be linear; it was chosen because the trend's direction was of more interest than its slope.
21 As discussed at greater length in Brown, Kapteyn, and Mitchell (2013), a break-even analysis calculates the number of years one would have to live for the sum of the additional money gained by delay to offset the money forgone by not claiming earlier.
22 Appendix Table B-3 shows the underlying data.
23 Appendix Table B-4 shows the underlying data.
24 Most workers claim benefits by age 70, although the share is not 100%.
25 As noted in Appendix A, excluding foreign-born workers did not change the results.
26 The 1956 Social Security Act Amendments made actuarially reduced retired-worker benefits available to women aged 62.
27 To approximate Bosworth, Burtless, and Zhang (2016), I set the minimum 2005 earnings cut-off at $5,150 and used the Consumer Price Index for All Urban Workers to adjust that amount for all other years.
References
Aaron, Henry J. 2013. “Nudged, Pushed, or Mugged: Policies to Encourage Older Workers to Retire Later.” In Closing the Deficit: How Much Can Later Retirement Help?, edited by Gary Burtless and Henry J. Aaron (72–90). Washington, DC: Brookings Institution Press.
Aziz, Faye, and Warren Buckler. 1992. “The Status of Death Information in Social Security Administration Files.” Paper presented at the 1992 annual meeting of the Joint Statistical Association, Boston, MA (August 9–13).
Bosworth, Barry, Gary Burtless, and Eugene Steuerle. 2001. “Lifetime Earnings Patterns, the Distribution of Future Social Security Benefits, and the Impact of Pension Reform.” Social Security Bulletin 63(4): 74–98.
Bosworth, Barry, Gary Burtless, and Kan Zhang. 2016. “Later Retirement, Inequality in Old Age, and the Growing Gap in Longevity Between Rich and Poor.” Economic Studies at Brookings. Washington, DC: Brookings Institution Press.
Brown, Jeffrey R., Arie Kapteyn, and Olivia S. Mitchell. 2013. “Framing and Claiming: How Information-Framing Affects Expected Social Security Claiming Behavior.” The Journal of Risk and Insurance 83(1): 139–162.
Clingman, Michael, and Kyle Burkhalter. 2019. “Scaled Factors for Hypothetical Earnings Examples Under the 2019 Trustees Report Assumptions.” Actuarial Note No. 2019.3. Baltimore, MD: SSA, Office of the Chief Actuary.
Cohen, Wilbur J., and William L. Mitchell. 1961. “Social Security Amendments of 1961: Summary and Legislative History.” Social Security Bulletin 24(9): 3–11, 33. https://www.ssa.gov/policy/docs/ssb/v24n9/v24n9p3.pdf.
Coile, Courtney, Peter Diamond, Jonathan Gruber, and Alain Jousten. 2002. “Delays in Claiming Social Security Benefits.” Journal of Public Economics 84(3): 357–385.
Epstein, Lenore A. 1966. “Early Retirement and Work-Life Experience.” Social Security Bulletin 29(3): 3–10. https://www.ssa.gov/policy/docs/ssb/v29n3/v29n3p3.pdf.
[GAO] Government Accountability Office. 2014. Retirement Security: Challenges for Those Claiming Social Security Benefits Early and New Health Coverage Options. GAO-14-311. Washington DC: GAO.
Guvenen, Fatih, Greg Kaplan, Jae Song, and Justin Weidner. 2017. “Lifetime Incomes in the United States Over Six Decades.” NBER Working Paper No. 23371. Cambridge, MA: National Bureau of Economic Research.
Leonesio, Michael V., Benjamin Bridges, Robert Gesumaria, and Linda Del Bene. 2012. “The Increasing Labor Force Participation of Older Workers and Its Effect on the Income of the Aged.” Social Security Bulletin 72(1): 59–77. https://www.ssa.gov/policy/docs/ssb/v72n1/v72n1p59.html.
Muldoon, Dan, and Richard W. Kopcke. 2008. “Are People Claiming Social Security Benefits Later?” Issue Brief No. 8-7. Chestnut Hill, MA: Center for Retirement Research at Boston College.
Munnell, Alicia H., and Anqi Chen. 2015. “Trends in Social Security Claiming.” Issue Brief No. 15-8. Chestnut Hill, MA: Center for Retirement Research at Boston College.
Pattison, David. 2014. “Trends in Retirement and Claiming in the SSA Data.” Paper presented at the AARP Policy Conference on Social Insurance and Lifecycle Events Among Older Americans, Washington, DC (December 5).
Purcell, Patrick J. 2016. “Employment at Older Ages and Social Security Benefit Claiming.” Social Security Bulletin 76(4): 1–17.
Sherman, Sally R. 1985. “Reported Reasons Retired Workers Left Their Last Job: Findings From the New Beneficiary Survey.” Social Security Bulletin 48(3): 22–30.
Shuart, Amy N., David A. Weaver, and Kevin Whitman. 2010. “Widowed Before Retirement: Social Security Benefit Claiming Strategies.” Journal of Financial Planning 23(4): 45–53.
Smith, Creston M. 1989. “The Social Security Administration's Continuous Work History Sample.” Social Security Bulletin 52(10): 20–28.
[SSA] Social Security Administration. 2020a. “How Work Affects Your Benefits.” Publication No. 05-10069. https://www.ssa.gov/pubs/EN-05-10069.pdf.
———. 2020b. “When to Start Receiving Retirement Benefits.” Publication No. 05-10147. https://www.ssa.gov/pubs/EN-05-10147.pdf.
Waldron, Hilary. 2001. “Links Between Early Retirement and Mortality.” ORES Working Paper No. 93. Washington, DC: SSA, Office of Policy, Office of Research, Evaluation, and Statistics. https://www.ssa.gov/policy/docs/workingpapers/wp93.html.
———. 2002. “Do Early Retirees Die Early? Evidence from Three Independent Data Sets.” ORES Working Paper No. 97. Washington, DC: SSA, Office of Policy, Office of Research, Evaluation, and Statistics. https://www.ssa.gov/policy/docs/workingpapers/wp97.html.
———. 2004. “Heterogeneity in Health and Mortality Risk Among Early Retiree Men.” ORES Working Paper No. 105. Washington, DC: SSA, Office of Policy, Office of Research, Evaluation, and Statistics. https://www.ssa.gov/policy/docs/workingpapers/wp105.html.
———. 2012. “The Sensitivity of Proposed Social Security Benefit Formula Changes to Lifetime Earnings Definitions.” Social Security Bulletin 72(2): 1–22. https://www.ssa.gov/policy/docs/ssb/v72n2/v72n2p1.html.
———. 2013. “Mortality Differentials by Lifetime Earnings Decile: Implications for Evaluations of Proposed Social Security Law Changes.” Social Security Bulletin 73(1): 1–37. https://www.ssa.gov/policy/docs/ssb/v73n1/v73n1p1.html.
———. 2015. “A Multidisciplinary Review of Research on the Distributional Effects of Raising Social Security's Early Entitlement Age.” ORES Working Paper No. 112. Washington, DC: SSA, Office of Retirement and Disability Policy, Office of Research, Evaluation, and Statistics. https://www.ssa.gov/policy/docs/workingpapers/wp112.html.
———. Forthcoming. “Working and Claiming Behavior at Social Security's Early Eligibility Age Among Men by Lifetime Earnings Decile.” ORES Working Paper No. 115. Washington, DC: SSA, Office of Retirement and Disability Policy, Office of Research, Evaluation, and Statistics.
Weaver, David A. 2010. “Widows and Social Security.” Social Security Bulletin 70(3): 89–109.