National Trends
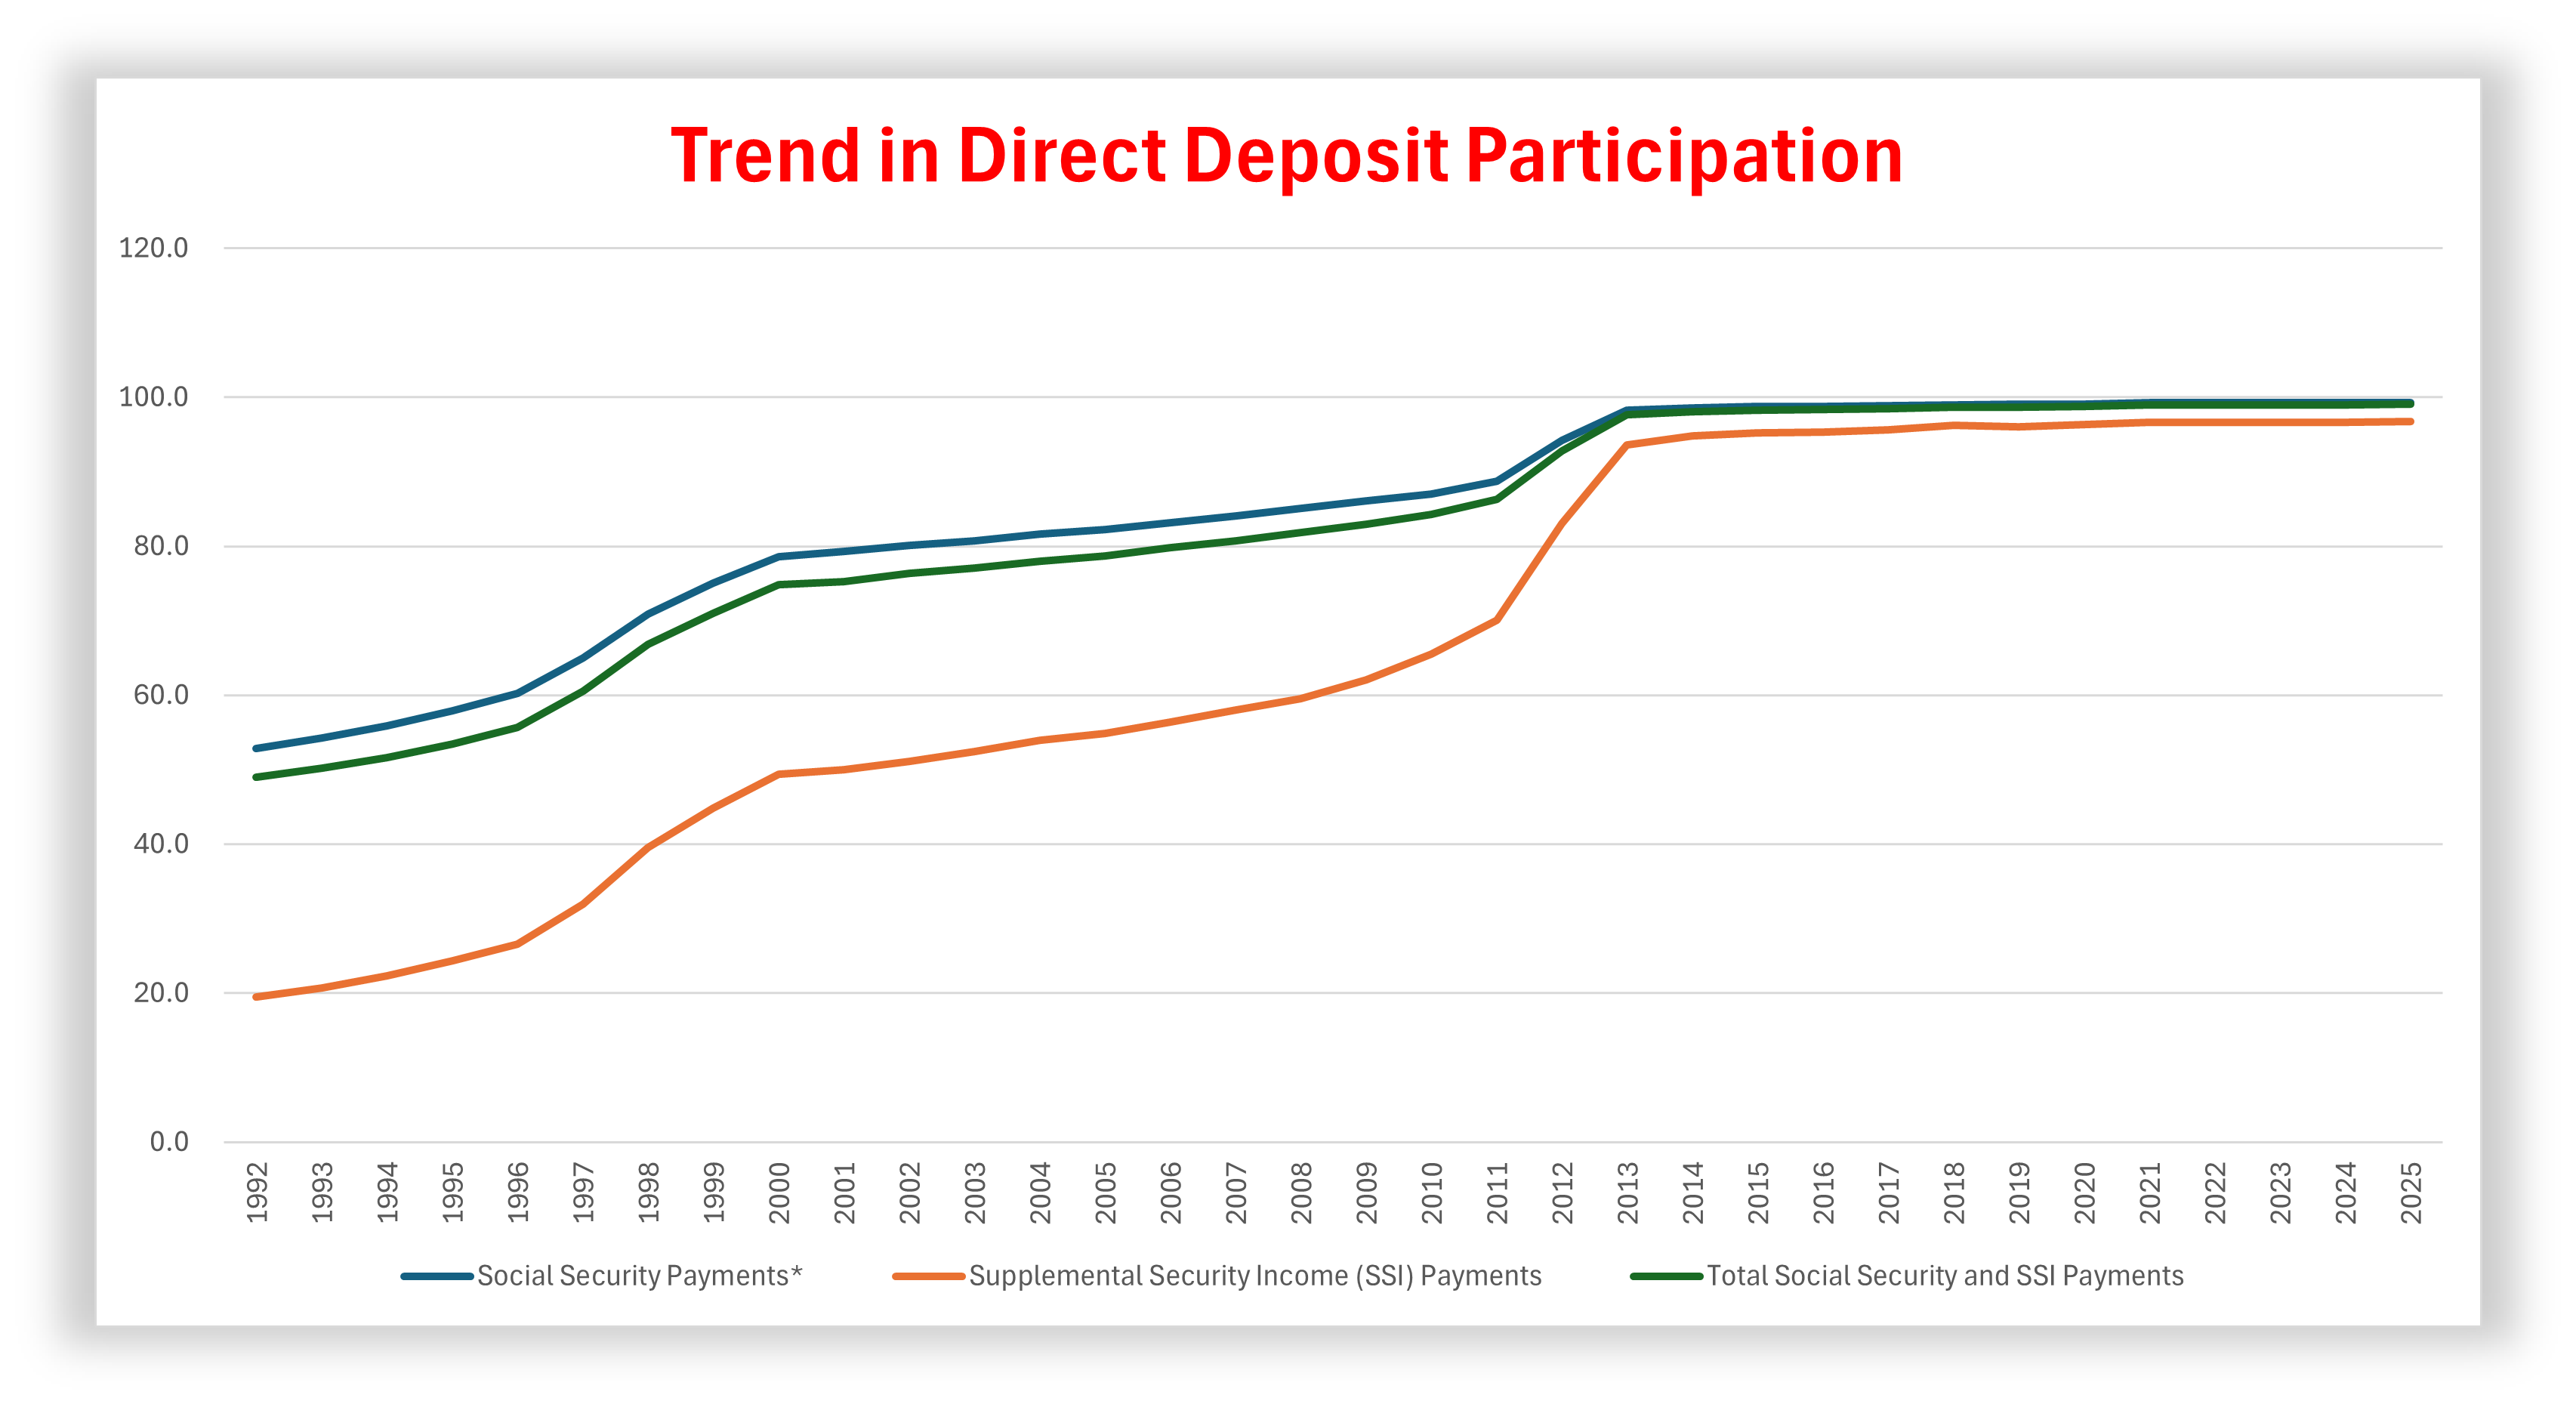
* Retirement, Survivors & Disability Benefits
* Retirement, Survivors & Disability Benefits
| Fiscal Year | Social Security Payments | Supplemental Security Income (SSI) Payments | Total Social Security and SSI Payments |
|---|---|---|---|
| 2025 | 99.3 | 96.8 | 99.1 |
| 2024 | 99.3 | 96.6 | 99.0 |
| 2023 | 99.3 | 96.6 | 99.0 |
| 2022 | 99.3 | 96.6 | 99.0 |
| 2021 | 99.3 | 96.6 | 99.0 |
| 2020 | 99.1 | 96.3 | 98.8 |
| 2019 | 99.1 | 96.0 | 98.7 |
| 2018 | 99.0 | 96.2 | 98.7 |
| 2017 | 98.9 | 95.6 | 98.5 |
| 2016 | 98.8 | 95.3 | 98.4 |
| 2015 | 98.8 | 95.2 | 98.3 |
| 2014 | 98.6 | 94.8 | 98.1 |
| 2013 | 98.3 | 93.6 | 97.7 |
| 2012 | 94.2 | 83.1 | 92.8 |
| 2011 | 88.7 | 70.1 | 86.3 |
| 2010 | 87.0 | 65.5 | 84.3 |
| 2009 | 86.1 | 62.1 | 83.0 |
| 2008 | 85.1 | 59.5 | 81.8 |
| 2007 | 84.1 | 58.0 | 80.7 |
| 2006 | 83.2 | 56.4 | 79.8 |
| 2005 | 82.3 | 54.9 | 78.7 |
| 2004 | 81.6 | 54.0 | 78.0 |
| 2003 | 80.7 | 52.4 | 77.1 |
| 2002 | 80.1 | 51.1 | 76.4 |
| 2001 | 79.3 | 50.0 | 75.3 |
| 2000 | 78.6 | 49.4 | 74.8 |
| 1999 | 75.0 | 44.8 | 71.0 |
| 1998 | 70.9 | 39.6 | 66.8 |
| 1997 | 65.0 | 32.0 | 60.6 |
| 1996 | 60.2 | 26.6 | 55.7 |
| 1995 | 57.9 | 24.3 | 53.5 |
| 1994 | 55.9 | 22.3 | 51.6 |
| 1993 | 54.3 | 20.7 | 50.2 |
| 1992 | 52.8 | 19.5 | 49.0 |